
DOCUMENTATION
-
- Why we created Best Trading Indicator
- Trading frameworks and their timeframes
- How to install a custom indicator on TradingView
- Why the BTI ALgo Global is a MUST for your trading
- Why a Plug & Play system can save you a lot of time and money
- How to update your indicator to be compatible with our Plug&Play scripts.
- Earn recurring passive income with our affiliates program
Algorithm Builder - Single Trend+ (Plug & Play)
Request Your Trial
(⬇️ Please click on the banner below ⬇️)

Introduction
The Algorithm Builder - Single Trend+ (Plug&Play) is made to detect the convergence of many unrelated indicators, and give a BUY or SELL signal whenever all the selected sub-indicators are converging in the same direction. The magic with that indicator is that you can connect your own indicator to it
Video Tutorial
The Plug & Play technology


The user input fields
Access KEY
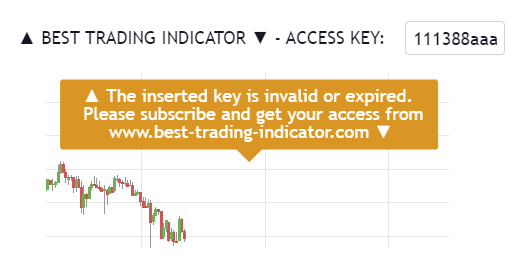
Here you'll need to insert the access key you received by email (within 2 business days after the date of order) This key has been generated for you according to your subscription package, and have a specific expiration date included in it.
If the key inserted is incorrect or expired, the indicator displays an orange label inviting you to subscribe again
Utilities
Algorithmic Supports and Resistances

If you want to select/unselect specific supports/resistances, you'll need to :
1 - Go to the Style tab
2 - Select/Unselect the ones that make sense to YOU according to asset/timeframe on the chart
3 - The Algo S/R buffer (value in units/lots) is used for the Risk/Reward Panel
You might not want your TP zones to be defined exactly on those S/R, but to let yourself a little bit of margin.
We thought about this margin buffer
because those S/R aren't always accurate levels - mostly because they're multi-timeframes zones (and otherwise trading would be too easy ^^).
It's up to you to decide how relevant this margin buffer
is, and if it could add some benefits to the overall trading strategy.
Profit/Loss and Risk/Reward Panel

The Panel displays (if selected) for the current trade only the PnL (Profit and Loss), and R:R (Risk to Reward) informations. We let you the ability to position the panel whenever you want in the chart - you'll only have to play with the X, and Y positions to get it displayed wherever you want
1. Algo SR and PnL Panel
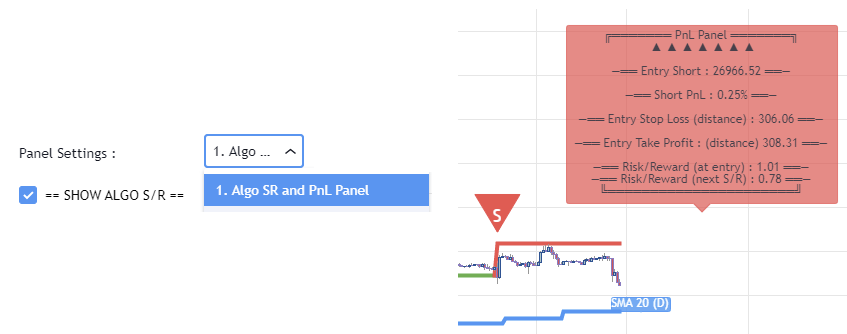
When selected it calculates automatically for each candle the PnL, and risk-to-reward ratio based on the Algorithmic SMAs (Simple Moving Averages).
A few notes :
- On that screenshot just above, the background is red because we're on a SHORT position. Otherwise, it's colored green for a LONG.
Entry Price : the price when the Algorithm Builder gives a signal.
- The Trade PnL in percentage.
- Entry Stop Loss : Distance (in currency/units) between the Supertrend (used as stop-loss), and the entry price.
- Entry Take Profit : Distance (in currency/units) of the nearest algorithmic SMA at the time of entry.
- Risk/Reward (at entry) : Using the Stop-loss/Supertrend distance at entry, and Take Profit at entry to compute the risk-to-reward ratio.
- Risk/Reward (next SR) : Gives the risk-to-reward ratio to the next nearest SR. Could be useful if you missed an entry, but can still get in the trade if the next SR is far enough to give a decent risk-to-reward ratio
Trade Manager

Stop-Loss Management

For what's following, let's assume that 2 is the stop-loss value you inserted in the indicator and the Algorithm Builder gives a BUY signal. It is NOT a recommendation at all, only an example to explain how this feature works.
- % Trailing : The Stop-Loss starts 2% away from the entry price - and will move up (because we're on a BUY trade as per our example) every time your trade will gain 2% profit
- Percentage : The Stop-Loss stays static 2% away from the entry price. There is no trailing here
-
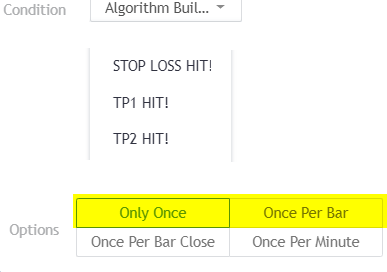
TP Trailing : This is a very excellent feature. The stop-loss is set 2% away when the trades start.
When the TP1 is hit, the stop-loss will be moved to the Entry price (also called breakeven).
When the TP2 is hit, the SL is moved to the previous TP1 position - Fixed : Set the Stop-Loss at a fixed position (value should be in currency/units)
Take Profits Management

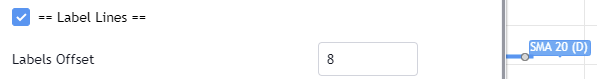
Labels Lines

Session hour's filter

It's important to note the the hours filter is based on the broker timezone - not on your chart timezone. If your chart sets in UTC+2, but you're displaying the price data from COINBASE:BTC/USD then the real timezone used is GMT-7
Connect your own external indicator

This is effortless to do, and anyone should be able to do it.
For our subscribers, we'll send the detailed process of how to add 2 lines of code at the end of their indicator - so that our Algorithm Builder - Plug&Play may use that external signal.
The quick video below (duration < 1min) shows how A) you can connect a RSI divergence indicator to your Algorithm Builder B) mix it with a Supertrend, and C) get all the Utilities updated accordingly
You only made a few clicks, and designed a powerful system intuitively.
Are we the only ones to think this is beyond the most impressive thing we've ever witnessed in the history of technical analysis?
Indicators
Overlay
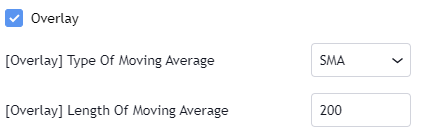
The Overlay gives a bullish signal if the price closes above the selected Moving Average. Otherwise, the returned signal is bearish
Supertrend

The Supertrend gives a bullish signal if the price closes above the red supertrend for the first time. Otherwise, the returned signal is bearish
MACD or MACD ZERO LAG

You can choose between a standard MACD or its alternative called MACD Zero Lag (known to be more reactive/less lagging that the standard version). There is no right or wrong choice here, all depends on your own trading strategy. The MACD or MACD Zero Lag gives a bullish signal if the oscillator goes positive for the first time. Otherwise, the returned signal is bearish
Moving Averages Cross
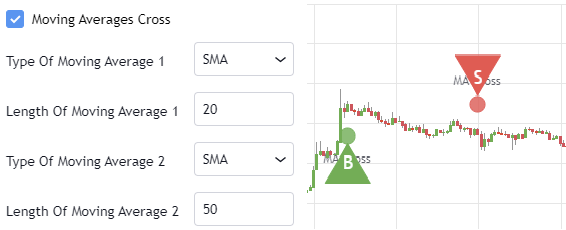
The Moving Averages cross bullish signal whenever the 2 selected moving averages cross for the first time. Otherwise, the returned signal is bearish
Price vs Ichimoku Cloud

The Price versus Ichimoku gives a bullish signal whenever the candle closes above the Ichimoku cloud. Otherwise, the returned signal is bearish
Trend Code
The Trend Code is part of our internal formula, and we cannot disclose what it is exactly. However, we'll surely tell you how to use it. As a rule of thumbs, the lower the input value is the fewer the number of trend codes is - the higher the input value, then the trend code will be more smoothed, and gives less sub-signals. (This is the classical behavior of any indicator anyway)
Pullback Value and Pullback Percentage

Pullback Value: the indicator expects a distance from the selected moving average in lots/units (i.e. Pullback Value SMA 20, and buffer 3 accepts the pullback whenever all the signals are converging, and the current price is 3 units/lots away from your SMA 20
Pullback Percentage: the indicator expects a distance from the selected moving average in percentage (i.e. Pullback Percentage SMA 20, and buffer 3 accepts the pullback whenever all the signals are converging, and the current price is 3 percent away from your SMA 20
Hard Exit (based on MACD)

Let's assume the simple configuration with a SMA 20/50 cross, and a Supertrend (5,5). The signal is bullish signal whenever the 2 selected indicators are converging. Otherwise, the returned signal is bearish
This vertical brown line appears because (in that specific scenario) we're in a BUY, but we get a hard exit/invalidation signal based on that MACD. This allows us to exit a losing trade sooner, and before it might hit your stop-loss
Alerts
BUY and SELL alerts

The screenshot should be self-explanatory enough
You mandatory need to create 1 alert for the BUY event, and 1 alert for the SELL event
The Algorithm Builder - Single Trend allows us to capture the alerts on those BUY green triangles, and SELL red triangles.
You'll have to create 1 alert per event (buy or sell) per asset (BTC, DOW, APPL, ...) per timeframe (m5, m15, ...).
For instance, if you add your Algorithm Builder - Single Trend to your chart. You have to create 2 alerts. A first one to capture the BUY event, a second one to capture the SELL event.
Depending on your TradingView subscription type, you might receive the alerts by email, and by SMS
Trend Manager alerts
You'll be able to create alerts based on our Trade Manager. It's recommended to wait to be in a trade, and after creating the Trade Manager alerts.
As we could recommend to trigger the BUY/SELL alerts on candle close (for more security/less risk for fakeouts), it's generally a best practice to set the Trade Manager alerts using the
We mean, once the SL/TP1/TP2 are hit, you might not want to wait for the candle close to act because it could be too late, and very often won't be in your favor.
🔔 Dynamic Alerts and TradingView automation 🔔
Here are the list of third-parties capturing TradingView alerts and forwarding them to many CFD/Crypto/Stocks brokers.
The process to connect the Algorithm Builder entries/exits signals to those systems is fairly easy.
You'll find more insight to make your alerts compatible with those systems here.
Request Your Trial
(⬇️ Please click on the banner below ⬇️)