
DOCUMENTATION
-
- Why we created Best Trading Indicator
- Trading frameworks and their timeframes
- How to install a custom indicator on TradingView
- Why the BTI ALgo Global is a MUST for your trading
- Why a Plug & Play system can save you a lot of time and money
- How to update your indicator to be compatible with our Plug&Play scripts.
- Earn recurring passive income with our affiliates program
Algorithm Builder - Multiple Trends
Request Your Trial
(⬇️ Please click on the banner below ⬇️)

Introduction
Video Tutorial
Multiple Trends versus Single Trend
A friend asked us recently Why using the Multiple Trends if we can use the Single Trend in a smaller timeframe, and get more entries that way?
We thought this was an excellent question, but the answer is obvious to us.
Using a Single Trend on a smaller timeframe to solely getting more entries will reduce the security of the given trades. We designed the Algorithm Builders to take a trade-in an identified trend but reducing the timeframe too much will mostly increase your risk - and might lead to capital loss.
By the way, this is a universal rule valid also for a significant majority of indicators.
Main signal versus Secondary signals

For the main and secondary trends, the color green symbolizes any identify "BUY" trend. And the color red symbolizes any identified "SELL" trend.
The MAIN trend symbol is unique and symbolized by a triangle.
The SECONDARY (could also be called re-entries) trends are multiple, and symbolized by a diamond.
In the Algorithm Builder, they're identified with the Additional keyword.
The user input fields
Access KEY
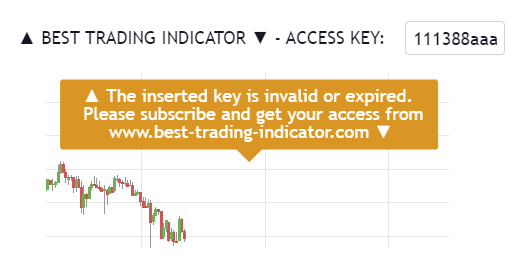
Here you'll need to insert the access key you received by email (within 2 business days after the date of order) This key has been generated for you according to your subscription package, and have a specific expiration date included in it.
If the key inserted is incorrect or expired, the indicator displays an orange label inviting you to subscribe again
Utilities
Display primary or secondary signals

It could be messy to display at the same time the primary, and secondary sub-signals. That's why we let you the option to select those you'd like to keep on your chart.
You can chose to display none of them by unchecking both checkboxes.
Algorithmic Supports and Resistances

If you want to select/unselect specific supports/resistances, you'll need to :
1 - Go to the Style tab
2 - Select/Unselect the ones that make sense to YOU according to asset/timeframe on the chart
3 - The Algo S/R buffer (value in units/lots) is used for the Risk/Reward Panel
You might not want your TP zones to be defined exactly on those S/R, but to let yourself a little bit of margin.
We thought about this margin buffer
because those S/R aren't always accurate levels - mostly because they're multi-timeframes zones (and otherwise trading would be too easy ^^).
It's up to you to decide how relevant this margin buffer
is, and if it could add some benefits to your overall trading strategy.
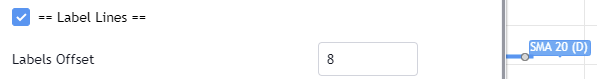
Labels Lines

Indicators
Primary/Main Trend
Overlay
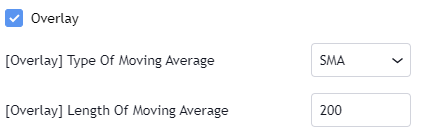
The Overlay gives a bullish signal if the price closes above the selected Moving Average. Otherwise, the returned signal is bearish
Supertrend

The Supertrend gives a bullish signal if the price closes above the red supertrend for the first time. Otherwise, the returned signal is bearish
MACD or MACD ZERO LAG

You have the option to choose between a standard MACD or its alternative called MACD Zero Lag (known to be more creative/less lagging that the standard version). There is no right or wrong choice here, it all depends on your trading strategy. The MACD or MACD Zero Lag gives a bullish signal if the oscillator goes positive for the first time. Otherwise, the returned signal is bearish
Triple Moving Averages Cross

The Three Moving Averages cross bullish signal whenever the 3 selected moving averages cross for the first time. Otherwise, the returned signal is bearish
The crossing rules are the same as the ones published on our Three MM Cross TradingView script. We engineered those rules after years of analyzing the charts, and traded them enough to know it's a powerful indicator to have in your trading toolkit

Price versus Ichimoku Cloud

The Price versus Ichimoku gives a bullish signal whenever the candle close above the Ichimoku cloud. Otherwise, the returned signal is bearish
Trend Code
The Trend Code is part of our internal formula, and we cannot disclose what it is exactly. However, we'll surely share with you how to use it. As a rule of thumbs, the lower the input value is the lesser the number of trend codes is - the higher the input value, then the trend code will be more smoothed, and gives fewer sub-signals. (This is the classical behavior of any indicator anyway)
Pullback Value and Pullback Percentage

Pullback Value : the indicator expects a distance from the selected moving average in lots/units (i.e. Pullback Value SMA 20, and buffer 3 accepts the pullback whenever all the signals are converging, and the current price is 3 units/lots away from your SMA 20
Pullback Percentage : the indicator expects a distance from the selected moving average in percentage (i.e. Pullback Percentage SMA 20, and buffer 3 accepts the pullback whenever all the signals are converging, and the current price is 3 percent away from your SMA 20
Secondary/Additional Trend(s)
Is it really needed?
Maximum number of re-entries in a secondary trend

The example on the screenshot should be self-explanatory enough hopefully. We might sound like a broken record
again, but better to overcommunicate on that : there isn't a recommended number - all depends on your trading strategy as a whole.
The secondary sub-indicators identifier

They're identified with the keyword Additional, but they're the same indicators used for the primary trend.
Those are used to display the diamond symbols.
You might have noticed we removed a few for the secondary trend like the (MACD ZERO LAG, and ICHIMOKU) - we did so to simplify the tool.
Hard Exit (based on MACD)

Let's assume the simple configuration with a SMA 20/50 cross, and a Supertrend (5,5). The signal is bullish signal whenever the 2 selected indicators are converging. Otherwise, the returned signal is bearish
This vertical brown line appears because (in that specific scenario) we're in a BUY but we get a hard exit/invalidation signal based on that MACD. This allows to exit a losing trade sooner, and before it might hit your stop-loss
Alerts
Main trend alerts

The screenshot should be self-explanatory enough
You mandatory need to create 1 alert for the BUY event, and 1 alert for the SELL event
The Algorithm Builder allows to capture the alerts on those BUY green triangles, and SELL red triangles.
You'll have to create 1 alert per event (buy or sell) per asset (BTC, DOW, APPL, ...) per timeframe (m5, m15, ...).
For instance, if you add your Algorithm Builder to your chart. You have to create 2 alerts. A first one to capture the MAIN BUY event, a second one to capture the MAIN SELL event.
According to your TradingView subscription type, you might receive the alerts by email, and by SMS
Secondary trend alerts
It's precisely the same principle here.
On the top of the MAIN alerts - you'll have to create 2 alerts to capture the additional BUY green diamonds, and the additional SELL red diamonds.

Same here - the alerts on the diamonds have been enabled by our tool but you should activate, and set them up yourself.
Don't worry it's super easy to do :)
You'll have to create 1 alert per event (buy or sell) per asset (BTC, DOW, APPL, ...) per timeframe (m5, m15, ...).
For instance, if you add your Algorithm Builder to your chart. You have to create 2 alerts. A first one to capture the ADDITIONAL BUY event, a second one to capture the ADDITIONAL SELL event.
According to your TradingView subscription type, you might receive the alerts by email, and by SMS
Request Your Trial
(⬇️ Please click on the banner below ⬇️)