DOCUMENTATION
-
- Why we created Best Trading Indicator
- Trading frameworks and their timeframes
- How to install a custom indicator on TradingView
- Why the BTI ALgo Global is a MUST for your trading
- Why a Plug & Play system can save you a lot of time and money
- How to update your indicator to be compatible with our Plug&Play scripts.
- Earn recurring passive income with our affiliates program
BEST Trade Manager with Automatic Take Profits
Request Your Trial
(⬇️ Please click on the banner below ⬇️)
Introduction
Current Version: 4.7
This is very likely the most loved utility script that we shared on TradingView.
This Trade Manager is standalone and available on our BEST TradingView Standalone scripts library.
Please check our TradingView troubleshooting guide if you encounter any issue when installing the indicator (scaling, weird display, red error, etc.)
The concept is simple: plugging any indicator to the script and get real-time analytics with :
1. Multiple options for Stop-Loss/Take-Profits
2. Analytics panel (Profit and Loss in percentage and points value, max drawdown/profit, risk-to-reward ratios, ...)
3. Labels showing the current stop-loss/profits price levels
4. TradingView alerts and dynamic alerts
The indicator is also included in our Algorithm Builders, and certainly helps you immensely analyzing your charts and your trades.
We made sure that all the graphical elements on the chart will be updated in real-time whenever our user change anything on the TradingView indicator configuration.
We also enabled dynamic alerts for the Trade Manager component.
More info available in the Alerts section below
Connect your own external indicator to the Trade Manager
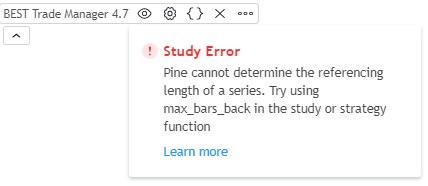
When you'll load the trade manager for the first time, it won't be connected to any TradingView indicator.
That's why you'll see a error message as per the image above. Once you'll connect your indicator, the error disappears

On the screenshot above, we're showing how to connect a two SMA cross indicator to our Trade Manager, but the process is exactly the same for any other indicator.
Our subscribers have access to the tutorial for updating their indicator quickly, and then connect it to our indicator.
For the Algorithm Builders, you won't have anything to do - this is already included.
This is not magic, neither is sorcery, but certainly is way beyond the most remarkable technical trading tool we've ever developed on TradingView (even across all brokers we know).
Unconnect your Trade Manager indicator from the chart
In case you don't want to use the Trade Manager, you can deactivate the it from your chart in 2 ways
1. Select a different external indicator/connector. As an example, below I'm chosing close referring to the candle close value

2. click on the 👁️🗨️ (eye icon) next to the Trade Manager indicator name on your chart. (top left)
Candles coloring and labels location


- Colour candles based on trend state: automatic candles coloring based on profitability. Light color when beyond the entry price, dark color otherwise.
- SL/TP Labels X Position: You can adjust the horizontal labels positions with the field SL/TP Labels X Position
Labels Lines


Stop-Loss Management
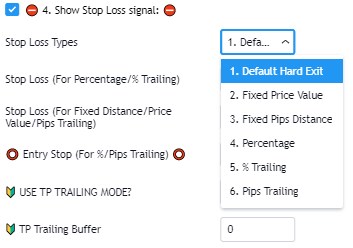
Selecting the Default option means the trader doesn't use a custom Stop-Loss. And solely use the included hard-exit as the Stop-Loss signal.
For what's following, let's assume that 2 is the stop-loss percentage value you inserted in the indicator and the Algorithm Builder gives a BUY signal. This is NOT a recommendation at all, only an example to explain how this feature works.
- % Trailing : The Stop-Loss starts 2% away from the entry price - and will move up (because we're on a BUY trade as per our example) every time your trade will gain 2% profit
- Percentage : The Stop-Loss stays static 2% away from the entry price.
- ATR Multiple: Set the Stop-Loss 2 times the ATR value below the entry price.
Now using 100 as example for the options below:
- Fixed Price Value: Set the Stop-Loss at a fixed position (value should be in currency/units of value/price level on the chart)
- Fixed Price Value: Set the Stop-Loss at a fixed position (value should be in currency/units of value/price level on the chart)
- Fixed Distance Value: Set the Stop-Loss at a fixed points/pips distance value (example for a LONG: 100 sets the stop level 100 pips below the entry price).
Pips Trailing : This one is a unique trailing-stop we invented.
Your pips trailing needs an Entry-Stop value - basically the stop value when the entry signal appears. Then it needs a trailing in pips (or fiat like EUR, USD, ...) value.
For instance for a LONG entry, Entry Stop pips = 50 and Stop Loss (Pips trailing) = 100 will:
- Set the entry stop 50 pips below the entry
- Once the move will be 100 pips profitable (aka 100 pips above the entry price), the stop level will be trailed from this trigger level of entry_price + 100 pips.
Use TP Trailing : This is a very remarkable feature. The stop-loss is set 2% away when the trades starts.
When the TP1 is hit, the stop-loss will be moved to the Entry price (also called breakeven). Then when the TP2 is hit, the SL is moved to the previous TP1 position.
And when TP3 is hit, the SL is moved to the previous TP2 level.
Take Profits Management

You can manage up to 3 take profit levels based either on percentage or price value target.
- Percentage: for instance, setting the % TP1 to 2% will set the TP1 level 2% away from the entry price.
- Price value: for instance, setting the value for Bitcoin TP1 target 10000, sets the TP1 level at that price level.
- Distance value: for instance, setting the value for BTC/USD TP1 target 200, sets the TP1 level 200 USD away, from the entry price.
- ATR multiple: Set the 3 Take Profit levels based on ATR multiple values
- Supports and Resistances: See below for more details
Automatic Take Profit based on Supports and Resistances
We know this feature was awaited for a long time - we had to wait for TradingView to release a new Pine feature before releasing that one.
You may use a combination of pivots and/or SMAs for your automatic take profit levels. The TP levels are updated whenever the S/Rs are moving - for example, if a SMA for instance is going down, your TP also will automatically goes down and stay adjusted to the SMA level
With this mode, the Take Profit label and line stop moving whenever the take profit level is hit.
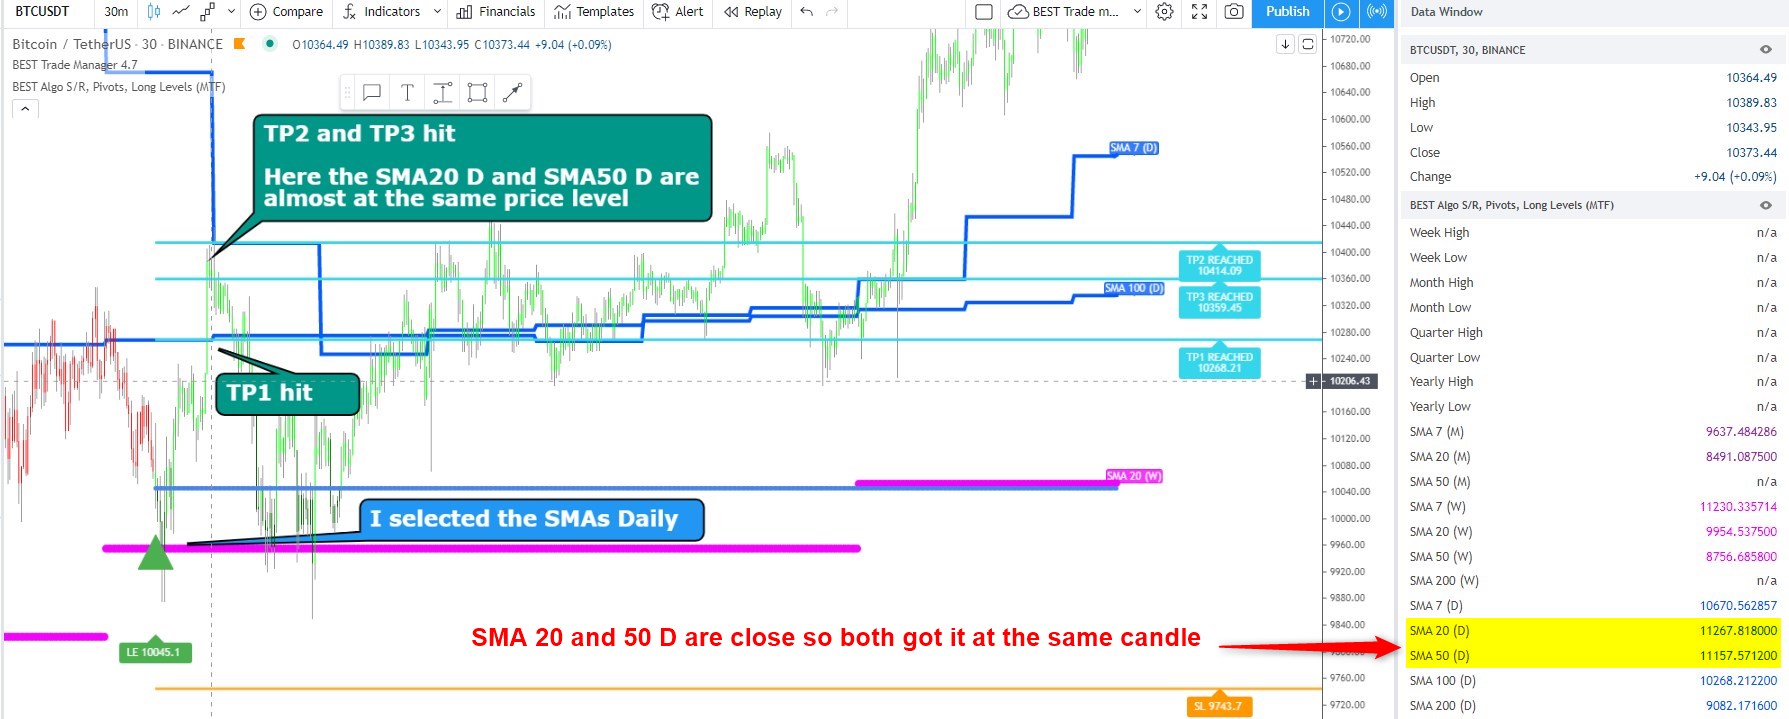
Use cases - Take Profit on Supports/Resistances
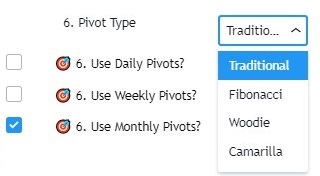
- Select Daily Pivots and Weekly Pivots and Monthly SMAs
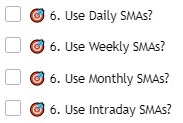
- Select Weekly Pivots and Daily SMAs and Intraday SMAs
Our point is you can select multiple Supports/Resistances types and timeframes. Then, the Trade Manager will automatically select the 3 nearest available S/Rs
Select the Take Profit 6.Supports and Resistances option
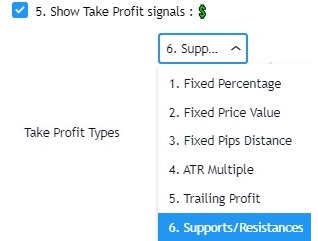
Select your Pivots Type and Timeframes
Select your SMAs timeframes
Select your security margin for your profits
This is an optional feature. By default, letting both at 0 deactivates any concept of setting your take profits slightly before
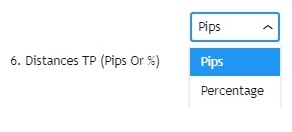
Two options for the distance type - which is going to be applied for both of inputs below
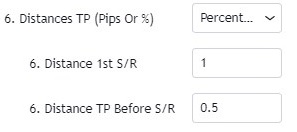
- Distance 1st S/R: imagine you get an entry but you're right on an or several supports/resistances. You may not desire taking your profit after a 10 USD move :)
That's why we included this concept. If I'm facing a set of S/Rs and the next set of S/Rs is let's say 2% further, then I can command the Trade Manager to disregard the nearest set of S/Rs.
With this, I won't exit my positions too early.
- Distance TP before S/R: It's best practice to not taking profit right on your zones but slightly before.
For example, here I decide to set my TP levels 30 USD (pips) before the actual supports/resistances levels.
This is an interesting way of setting a security margin to TP hedging against the risk of slippage and not being filled right on the support/resistance you're aiming for.
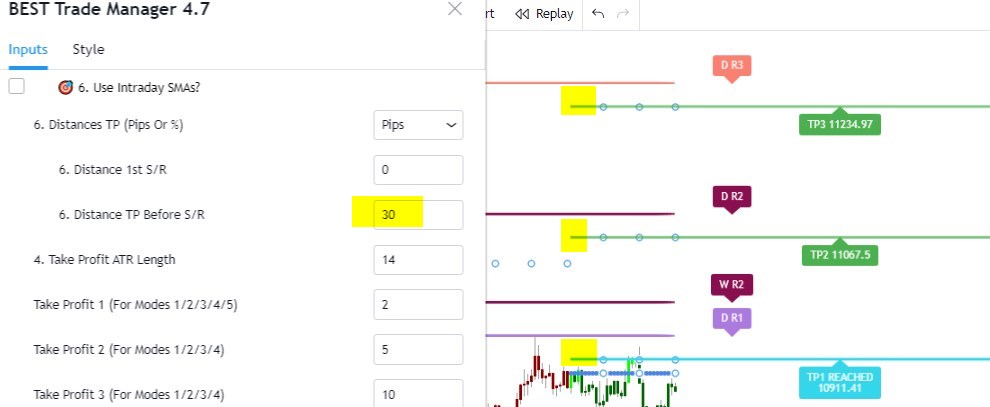
Another example with:
- Distance TP in Percentage
- Distance 1st S/R = 1%
- Distance TP Before S/R = 0.5%

The above means I don't want to consider the S/Rs before a 1% move in the expected direction AND I want to TP 0.5% before my selected supports and resistances.
❌ Hard Exits ❌
We included the hard exit indicators in the Trade Manager - as we also did for the Algorithm Builders.
The hard exit (or invalidation) is a fundamental part of the Best Trading Indicator™ method. We explained numerous times on TradingView, our website, and social media channels why we "love" this concept so much, and how it saved our capital numerous times from getting savagely wrecked by the market.
Note: We'll be adding new Hard Exits indicators, and as you might know already; the subscribers will benefit from the upgrades for free :) - as explained on our Pricing page)

❌ Hard Exits - MACD ❌
On the left image, we use a MACD 20/50/50 as a dummy example.
Rule #1: A trader must keep using his/her logic : If enabled, the hard exit MACD has to make sense with your indicator signals. For example, if a trader uses entries based on a MACD 12/26/9, but invalidates using a MACD 20/50/50 - what do you think will happen ?
Answer: Probably nothing sensible because the hard-exit MACD 20/50/50 is more significant than the entries given by the MACD 12/26/9.
Without going any further into this edge case, our point is : the feature works if it has been thought of to exit a trade before a SL gets hit.
Rule #2: Must be used to reduce your losses - not your wins
A MACD is a momentum indicator - meaning when there is a decrease in the trend strength/velocity
, the MACD will drop, and might turns negative - When in a LONG trend, this is a valuable input as it alerts the trader the trend might goes south (perhaps a time to move up the SL and take a bit of profits or closing the trade if not already with a positive balance on that trade)
❌ Hard Exits - RSI Divergence ❌
The 2.RSI exits a signal whenever a regular or hidden RSI divergence in the opposite direction of the trade will be detected.
If you're looking to display those R(egular) and H(idden) small labels, I recommend that RSI divergence detector script.
❌ Hard Exits - MM Cross ❌
The 3.MM Cross exits a signal whenever a moving average cross in the opposite direction occurs
🔔 Alerts 🔔

The screenshot should be self-explanatory enough
You mandatory need to create 1 alert for the BUY event and 1 alert for the SELL event
The Algorithm Builder allows to capture the alerts on those BUY green triangles and SELL red triangles.
You'll have to create 1 alert per event (buy or sell) per asset (BTC, DOW, APPL, ...) per timeframe (m5, m15, ...).
For instance, if you add your Algorithm Builder to your chart. You have to create 2 alerts. A first one to capture the MAIN BUY event, a second one to capture the MAIN SELL event.
According to your TradingView subscription type, you might receive the alerts by email and by SMS
Hard Exits alerts
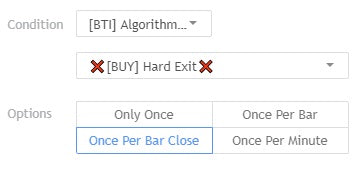
Trade Manager alerts
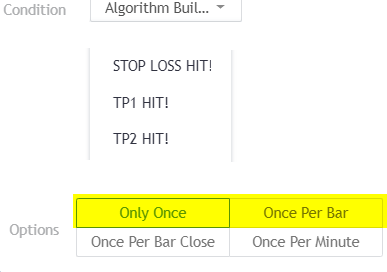
You'll be able to create alerts based on our Trade Manager. It's recommended to wait to be in a trade, and after creating the Trade Manager alerts.
As we could recommend to trigger the BUY/SELL alerts on candle close (for more security/less risk for fakeouts), it's generally a best practice to set the Trade Manager alerts using the
We mean, once the SL/TP1/TP2 are hit, you might not want to wait for the candle close to act, because it could be too late, and very often won't be in the trader favor.
🔔 Dynamic Alerts and TradingView automation 🔔
Here are the list of third-parties capturing TradingView alerts and forwarding them to many FOREX (CFD) brokers.
The process to connect the Algorithm Builder entries/exits signals to those systems is fairly easy.
You'll find more insight to make your alerts compatible with those systems here.
Request Your Trial
(⬇️ Please click on the banner below ⬇️)

