DOCUMENTATION
-
- Why we created Best Trading Indicator
- Trading frameworks and their timeframes
- How to install a custom indicator on TradingView
- Why the BTI ALgo Global is a MUST for your trading
- Why a Plug & Play system can save you a lot of time and money
- How to update your indicator to be compatible with our Plug&Play scripts.
- Earn recurring passive income with our affiliates program
How to install a custom indicator on TradingView
Request Your Trial
(⬇️ Please click on the banner below ⬇️)
For using TradingView Indicators you need a TradingView account
This video may answer your questions about scaling, adding custom indicators, and alerts.
After you placed an order
All the paid scripts from this website are published using the invite-only mode on TradingView.
Once we receive confirmation a subscription has been requested, we'll add your TradingView login to the list of allowed users.
We'll also send you your access keys by email. You'll receive an email with your access key(s) per subscription package and/or access key for the purchased utility.
How to add an invite-only script to your chart
This is very easy to do
1. Click on Indicators from the header menu
2. Type your indicator name
- You'll receive the exact indicator names by email
3. Make sure those indicators are coming from @Daveatt.
4. Start playing with the tools and enjoy

Remove the candles border

The candles are displayed nicely and with clear colors For a LONG:
- below the entry price is dark green
- above the entry price is light green
For a SHORT:
- above the entry price is dark red
- below the entry price is light red
How to remove the grid lines
Some traders may prefer hiding the chart grid lines. Offering here a solution for doing it

Scaling issues
There is nothing we can do to prevent that, but we know that TradingView could release a feature soon to prevent this scaling "issue" from happening.
It might only happen the first time you add the indicator to your chart.
The good news 👍: it could be solved in 2 simple steps only.
- Step 1: right click on the right price scale
- Step 2: Choose Auto (Fits Data to screen only)
We provide below some guidance to solve this side-effect.


What if the indicator is not loading
If you don't see any red error message or three horizontal dots or the loading label or nothing at all, then... it may be a network/wifi issue.
In that case, the only thing to do is refreshing the page and/or fixing your internet connection.
Could also be that you didn't enter your access key and that's why nothing is displayed
What if the indicator displays a red error

Many of our scripts contain thousands of lines of codes and might take a bit of time to get executed the first time you'll add them to your chart(s).
If your internet network is not fast enough or there are some latencies, you might get the issue as shown on the left image.
To work around that on both Desktop and Mobile, you'll either need to :
- Click on the 👁️🗨️ (eye icon)
- or refresh the whole page (F5/Refresh icon on Desktop and the usual way to refresh a page on your mobile device)
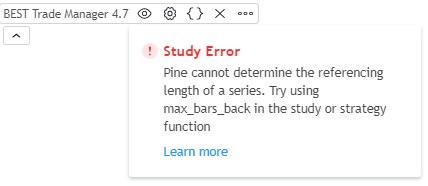
Plug and Play red study error

When you'll load the trade manager or Algo single/multiple trends or backtester for indicators for the first time, it won't be connected to any TradingView indicator.
That's why you may see an error message as per the image above.
Once you connect your indicator(s), the error disappears and the indicator loads the visual elements on your TradingView chart
What to do if the signals are hidden by other elements
In case your signals are a bit hidden by tons of Algo Supports/Resistances and want them to be displayed more clearly on your charts.
1. Move your mouse cursor on your indicator name (left part of your screen)
2. Click on the best algo builder MORE icon (three horizontal dots)
3. Select visual order
4. Select Bring to front


What if the indicator displays a calcul timeout error

Same as described just above.
Click on the 👁️🗨️ (eye icon)
- or refresh the whole page (F5/Refresh icon on Desktop and the usual way to refresh a page on your mobile device)
Hiding your chart indicators settings
By default, TradingView displays some n/a and indicator values. It clutters the chart a lot.
Then, I recommend unchecking the two checkboxes mentioned below.
You'll see this behavior when those 2 are checked (which doesn't look nice we all agree).


Also, if you become a subscriber you will be given a private subscription key, We highly recommend changing your chart settings through.
Settings > Status Line > Indicator Arguments
and 'unchecking' the Indicator arguments checkbox.
This hides your product key from the public when sharing your winning trades with your friends.
How to split your chart?
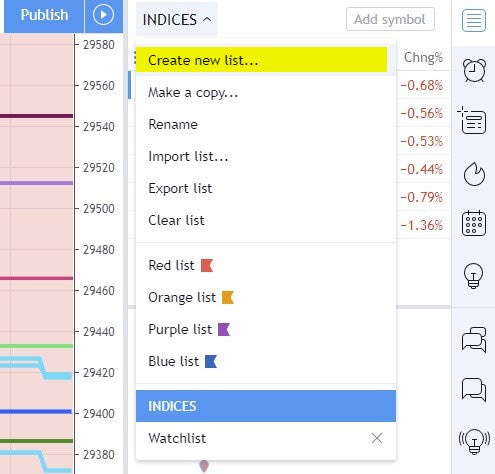
Step 1: Create your list of symbols

Step 2: Add the relevant symbols
I usually create 1 list per asset class. So, 1 for indices, 1 for crypto etc.
Note: To add the FXCM symbols, there is a "hack"
Let's use US30 as an example.
1. Type exactly US30
2. Press Enter from your keyboard
3. This will default into the FX:US30 quotation (FX like FXCM)

Step 3: Use the chart splitting feature
Make sure to overlay your cursor on the (i) to learn what those options are doing
Example: to add the US30 m1 and m5 on a split chart, we should:
1. click on the split square icon located at the top right of your TradingView
2. click on the US30 symbol from the list created in Step 1
3. from there save your chart (CTRL+S shortcut), load the 1-minute timeframe to get both the 1 and 5 minutes on the same view.

How to delete an indicator

Click on the small (x) icon
Alerts not firing?
TradingView alerts are linked to instances of chart/resolution + indicator settings.
Each time you edit the settings of an indicator on your chart, a new instance is created.
Thus your alerts still link to the old settings until they are edited (updated) or recreated.
🔔 Please make sure you deleted the previous alerts and created new ones every time we're sending an indicator update.
Then select "Edit" on the alert and select the new version of the indicator settings in the "Condition" dropdown.
Ensure triggers are correct and the expiration time well into the future and hit save, best wait a few seconds before editing the next alert.
Once you are done, reload your TradingView tab again and double check your alerts.
How to apply the exchange timezone on your chart?
Is it needed?
Yes! if you use hourly filters from our Algorithm Builders or your own script.
By default, TradingView scripts refer to the exchange timezone.
To compare apple to apple, we recommend setting your chart with the Exchange timezone.
To change the chart’s time zone, we first need to open the instrument settings window.
One way to do so is by clicking on the gear icon, which displays to the right of the instrument’s name on the chart.
In the settings window that this opens we select the ‘Timezone/Sessions’ tab. There we use the pull-down menu of the ‘Time Zone’ option to set the chart’s time zone to "Exchange"

An alternative way of doing it is to use the clock/date range option below your chart.


TradingView hot keys
List of convenient hot keys (keyboards shortcuts) in TradingView.
TradingView complete list of the best hotkeys
How to import/export a script configuration?
Whenever you have an indicator with tons of inputs, you know that anytime you change the source or download a new version that you're losing your config. It's annoying and time-consuming to re-insert the "50" inputs of our fav indicators every time
Step 1: download this Google chrome extension
Step2: How to export a TradingView config

Go to your favorite indicator settings and click on Export
It appears after the extension has been installed.
It will export the configuration in your clipboard. You'll only need to paste it in a text file.
Step 3 - How to import a config


Paste an export file into the indicator extension panel and click on Import
Removing the exit warning

Whenever we exit a TradingView tab, we get an annoying warning message asking us to confirm we do want closing the tab.
To prevent this, I found the Let me out extension blocking popup messages like "Are you sure you want to leave this page?" when navigating away from some sites.
URL: Let me out Chrome extension
Enable the Extended Trading Hours

This is useful for intraday stocks trading for example
To see the pre/post market data, we need to enable this option. However, upon activation, it will display the pre/post trading hours with a blue background.

As I don't like having them displayed like this, I hide this blue color by setting both color opacity to 100%.
Opactiy = 100% has the effect to hide those extra colors but you still have access to the pre/post trading hours data.
Display the BID/ASK price
To display the bid/ask prices and the spread, follow the 2 simple steps below from your chart settings

Request Your Trial
(⬇️ Please click on the banner below ⬇️)

