
Our Trading Method
A Few Easy Steps To Get Started
Step 1
First, subscribe to your desired package from our Pricing page
Then, download your new TradingView scripts based on our Trading Method.
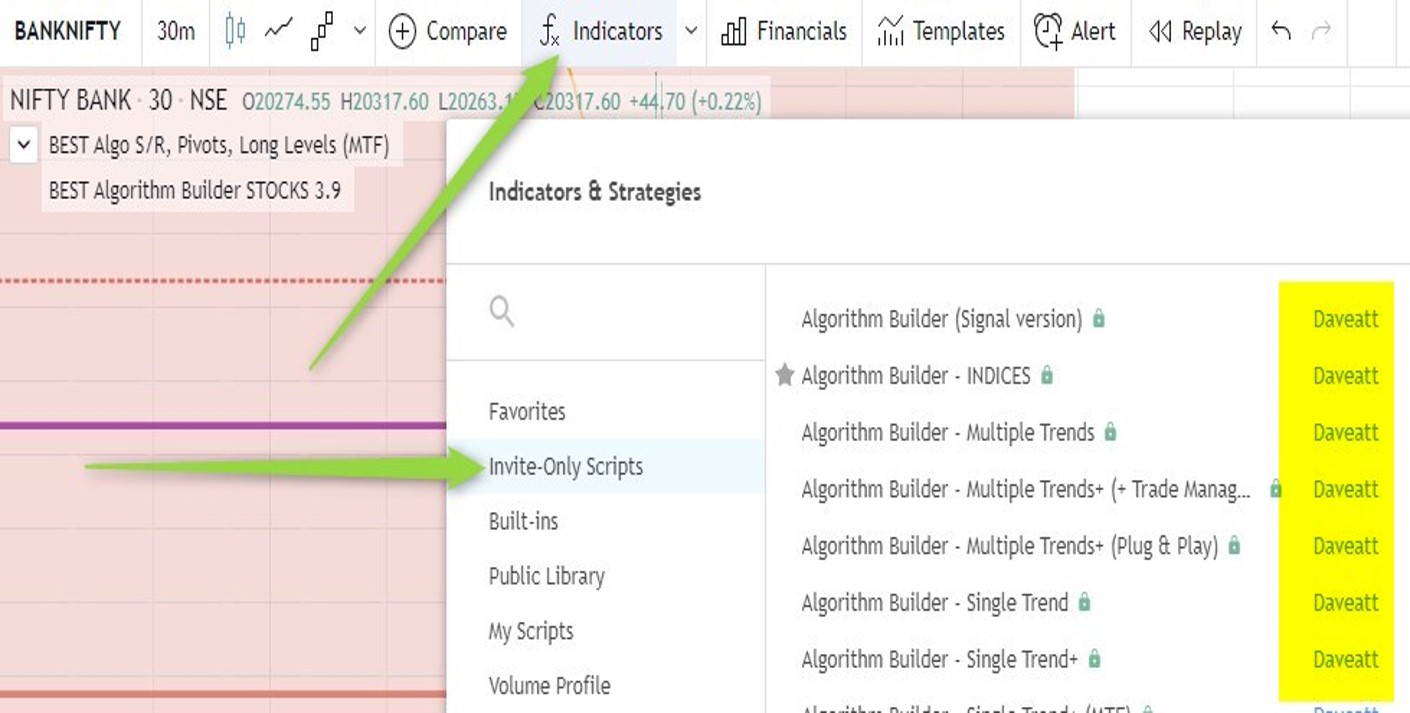
Click on the Indicators icon at the TOP of your TradingView
Your indicators are available in your Invite-only list.
Make sure the author (as per the image) is Daveatt


Step 2
We're not scripts sellers but trading coachs.
Subscribers have access to the highlights of our trading course/method in a PDF format upon subscription.
It's a structured trading method for all traders explaining with screenshots the main use cases.
They also have access to our private ![]() Discord chat room and the BTI Knowledge Base giving a lot more insights, live reviews, daily video coaching, etc.
Discord chat room and the BTI Knowledge Base giving a lot more insights, live reviews, daily video coaching, etc.

Step 3
TradingView users can create hundreds of alerts
BTI users have the option to create 1 merged alert per asset/timeframe or 1 alert per asset/timeframe/event
By event, we mean "Buy, Sell, Stop, Take Profit".
We provide extensive guidelines + videos showing how to create and update them
Those looking to automate their trading are pleased to play with our powerful systems and forward their alerts to their brokers
Step 4
Start paper trading or trading with small amounts during your first week. Trading always looks easy in hindsight but learning a new skill takes time.
You'll discover a systemic way of trading removing by design a lot of errors you used to make in the past (stopped out too often, winners closed too soon, ...).
Our students have to adapt their psychology to this uncommon but efficient way of trading. This implies unlearning a lot of concepts that we unfortunately see spread out across Twitter, Youtube, internet.
We’ll be there to support you via ![]() Discord or Email for your questions about our Pricing, Trading Method or TradingView scripts.
Discord or Email for your questions about our Pricing, Trading Method or TradingView scripts.

Trading Method Slides
This is the public trading method showing the high-level concepts.
Our students access the full course with the use-cases and guidelines to evaluate their risk before taking a trade
Full-screen mode  is recommended for better visibility.
The navigation (previous, pause, next) icons are available from the black menu bar below the slides
🔻 The text version of those slides is right below 🔻
ALL THE LESSONS LEARNED FROM 10+ YEARS DESIGNING TRADING SYSTEMS FOR PROFESSIONAL TRADERS, IN A SINGLE TRADING COURSE

Trading nowadays is different from the trading 20 or even 10 years ago...
Getting a solid edge became more challenging in an ecosystem run by trading bots, investment funds, VCs working with the smartest people in the world.
Anyone can Profit from trading if they use the "correct" tools and RISK Management system.
So let's work together
"Give a man a fish and you feed him for a day - teach a man to fish and you feed him for a lifetime"
We stand strong behind this quotation.
You'll get our entry and exit signals across many asset classes/timeframes - though we worked a ton on our Trading Course to teach you how to be consistently profitable.
Whether you're new or experimented trader, a non profitable or already profitable trader, Best Trading Indicator will teach you how to transform your trading into a money-printing machine.
Our decision helper tools simplify your trading by removing the subjectivity.
A systemic trading is the only way to get the rewards we expect and even more.
A Trading Course presented by Dave and his father
Dave teaches the BEST way to think about trading
Dave is the Best Trading Indicator CEO, and started trading from a very young age.
He's the one developing the trading scripts for Best Trading Indicator based on powerful custom convergence systems.
In this course, he shows how to evaluate your risk, adapt your position sizing, take profit levels and strategy for each trade based on Technical Analysis only.
The course is separated in chapters to make sure the key points are understood.
If any questions, Dave is available via email, discord or this website chat.
My father makes sure the signals stay up-to-date
Creating a system takes weeks at best (after many years of experience).
A system needs to be visually backtested and then used for paper/live trading for a few weeks - then confirming the new signals appear sooner with a trading security being at least equal to the previous convergence system.
Without a systemic trading system
- You spend a lot of time testing new indicators, backtesting, forward testing
- You lose a lot of money ("the learning experience fees")
- It takes years before trusting a system - then it's very easy to make silly mistakes such as double checking what other traders do on social media
- You can't effectively screen a lot of assets
- You get fatigued after a few hours every day - leading to more mistakes
With a systemic trading system
- You don't have to look for indicators, to backtest because we're doing it for you
- You own a method and scripts finally giving you an edge
- You don't need to monitor the social media channels anymore. Your focus is on your TradingView charts and alerts only.
- We provide the screening tools for all asset classes
- You have more time to analyze calmly and take sound decisions.
4 chapters to learn how to increase your trading capital
Configure your TradingView and Alerts
Learn the basic trading concepts and TradingView configuration techniques
Configure your TradingView
Learn how to add your new indicators on your charts, adjust the charts scaling and add custom timeframes
Alerts
Create your TradingView server-side alerts for the assets and timeframes you want to trade
Customize
Define your charts background, signals colors.
Activate the dark mode
Connect your Brokers
TradingView allows to trade directly form their platorms for many brokers.
Specialized yourselves with your brokers to know the pips value of your assets and how create a stop-loss and take-profit order at once
General Trading Guidelines
How to rewire your brain
Reduce the noise
Learn why checking the social media and listening to financial news is a sure way to lose
Major Announcements
BTI is 99% about technical analysis and 1% making sure you'll protect yourselves before high impact macro events (FED speech, Inflation rate announcements, FOMC, ...)
Evaluate the algorithmic Supports and Resistances
Appreciate how useful and life-saving they are.
Grasp how to interpret them to secure your entries and exits.
When NOT to trade
We enable dozens of great trades daily.
Though, there are times when it's really required to not stay invested.
The Trading Method
Now you're ready to read our proprietary trading method
Become efficient
Assess a signal RISK and potential PROFIT lasts 10/15 seconds with our methodology
Position Sizing
Use our rules to modulate your position size according to the entries RISK.
Decide when to use leverage or sub-leverage.
Indices
Appreciate our favorite asset class.
Indexes are the easiest to trade compare.
Forex
Forex assets are not too volatile.
Learn how to use our screeners + alerts on them and be there for the big movements.
Cryptocurrencies
Crypto assets are liked by many and are sensitive to fundamental news.
We don't monitor the fundamental at all with our trading method - only the charts and our signals matter
Stocks
Our systems are compatible with international stocks.
No subscriber from any country is left behind
Commodities
In times of crisis, commodities are invertly correlated to the dollar index.
Apply our rules to edge your cash position with anti-fragile assets.
Screeners
Get access to our screeners and recommendations to screen thousands of assets automatically.
Use Cases
Study our previous trades
Long and Short trades
Benefits from our high success-rate trades
Become a learning machine
Watch our use cases and how we recommend to trade very precise patterns
Videos
Review our tutorial videos to understand the "why" of our entries and exits
Cheatsheets
Receive our one-pager documentation that you can print and keep near your trading station.
You won't have any excuse to not trade our signals with the maximum efficiency
Summary
PART I - Our Story
PART III – Subscription Packages and Pricing
PART III – Highlights of our Trading Method
PART IV – Supports and Resistances
PART V – The Built-in Trade-Manager
PART V - Setting-up your TradingView
OUR STORY
Best Trading Indicator™ is a French company made by two French traders - a father and his son
We're teaching our proven trading method for all asset classes, all trader types (intraday, swing, scalpers) and compatible with many brokers.
We’re trading together with our subscribers, the same BEST entries/exits available on everyone’s TradingView charts
OUR STORY (2/3) - DAVE
The son is me Dave (or Daveatt from TradingView) CEO and co-founder of Best Trading Indicator™
I’m a quant trader with a Master in Computer-Science Engineering and Project Management
I’m now working for myself with 20 years of quantitative and trading experience.
My father and business partner taught me at a very young age, everything he knows about trading
My coding background was very useful when professional/retail traders hired me to design, code and implement their indicators/semi-automated/fully-automated strategies across many brokers.
I’ve been doing those freelance missions mainly from New York City/USA and then from other countries (Spain, Indonesia, Japan, London, Costa Rica, France, …)
OUR STORY (3/3) – MY FATHER
My father has been trading for 20+ years now and has a very advanced Trading Quant + Trading experience
We started with INDICES trading andwe’re still trading them actively
Our trading is diversified with a unique TradingView BEST Framework for each asset class and timeframe
We collaborated to mix his remarkable experience of the financial markets +my coding skills +our respective trading experience
Then we created Best Trading Indicator ™ as we are convinced that even inexperienced traders could benefit greatly from our systems
We’re often trading together in our home-made trading-room and constantly looking to optimize our systems for our subscribers
He’s assisting me behind-the-scene for teaching our customers our Trading Method course and accelerating their ramp-up
Part II – Our Subscriptions Packages and Pricing (1/3)
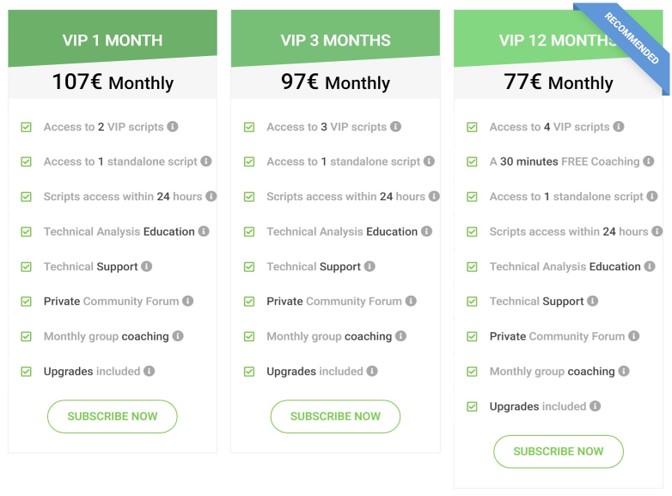
Part II – Our Subscriptions Packages and Pricing (2/3)
Our goal is to teach you what we learned over 20+ years in a few days/weeks only
3 VIP packages are available for recurring subscription
In term of benefits/features/scripts
- The VIP 3-months contains more advantages at a lower monthly price than the VIP-1-month
- The VIP-12-months contains more advantages at a lower monthly price than the VIP-3-months and VIP-1-month
The VIP-12-months gives access to a FREE 1-to-1 Coaching/Mentoring call that can be requested any time
Our Pricing Plans page is available from the header menu of our website
Part II - Our Subscriptions Packages and Pricing (3/3)
Upon subscription you’ll receive by email your access key within 1 business day
Your access key is valid for all your Best Trading Indicator scripts
For each script, insert your access key, double left-click on the GEAR icon located at the right of the indicator name OR on the indicator name directly
If inserted correctly , your chart will automatically refresh with the signals after a few seconds
Please Make sure to NOT insert additional character/blank space at the beginning or at the end of your access key
If your key isn’t working, please send us an email to dave@best-trading-indicator.com
Part II - Download your indicators
TRADING METHOD – GENERAL (1/4)
BAD traders only care about PROFIT and GREAT traders are obsessed with RISK management
BAD traders are on their way to become GREAT traders once they understand that RISK MANAGEMENT has more weight in the profitability equation than PROFIT We are annoyed with all the FAKE trading education out there from people that never traded.
What they teach only focus on the PROFIT dimension without a proper risk and money management.
Our systems for all asset classes (Stocks, Forex, Indices, Cryptocurrencies, Commodities), all traders type (Intraday, Scalp, Swing) and all traders profile (beginners and experimented) are designed to make hundreds of points, pips, EUR, USD, … every day with an extremely lowered RISK
TRADING METHOD – GENERAL (2/4)
We made our systems simple and abstract enough for any trader profile
With our Method, no other indicator, analysis, social media is needed in parallel
Our Trading Method is an assisted step-by-step guide available from our Community Forum to the VIP subscribers
Upon subscription, we send a summarised PDF version with a great coverage of most of the entry and exit setups
TRADING METHOD – GENERAL (3/4)
After 15-30 minutes of left-scrolling on your TradingView charts, you'll realise that:
- The entry and exit signals make sense
- Making more than [200-500] pips/points a day is really doable
Our goal is to re-wire your brains about what trading really is
- It's not a get-rich-quick scheme
- It's a get-richer process requiring you to trade in a more algorithmic way
Trading with low timeframes is our BEST answer to be more accurate and reducing your potential losses
Facts
- You'll have some losing trades.
- Not all trades are winners
- Our frameworks give more winners than losers
- Winners are much bigger than the losers
TRADING METHOD – GENERAL (4/4)
Our systems detect automatically strong convergences based on custom indicators we developed for ourselves over 20 years of trading
We are trading with the same TradingView scripts and the same Trading Method we’re teaching to our students Our entries and re-entries are designed to be as early as possible while keeping the RISK very low.We provide also a complete EXIT system for Stop-Loss and Taking Profit
TRADING METHOD – Fundamental and News
When trading, we recommend only looking at the HIGH macro events related to the assets you’re trading - Twitter, News will disturb you and clutter your judgement
Please never trade based on fundamental/news.
We guarantee you’ll burn yourself as the financial markets aren’t logical at all
Trading irrational markets based on what you think/feel the market should do based on news is the best way to lose
There is an obvious disconnect between the real economical world and financial world
TRADING METHOD – THE BEST WAY OF TRADING
You don’t need to stay in front of your charts all day
You’ll get alerted with your/our TradingView server-side alerts by (
Email and SMS and from your TradingView chart) Evaluating an entry/exit signal will take you no more than 15 seconds
Waiting in front of your charts when there is no signal increases your Fatigue and decrease your profits
It’s much smarter to set the alerts on the assets/timeframes you want to trade and do something else for the time being
The Built-In Trade Manager : Features
Included in ALL of our Algorithm Builder Frameworks
Compatible with Spot/CFDs/Futures/ETFs/Options/... trading products
Display the user-defined Take-Profit and Stop-Loss Levels andEnable TradingView server-side alerts
Define Take-Profit and Stop-Loss custom levels based on either price value/percentage/pips distance
Display the Risk-To-Reward ratios when the user-defined Stop and Take Profits are defined in the indicator settings
Display theBEST PnL Panel colored in green for a LONG and in red for a SHORT (The default colors may be changed from the Style tab of your Algo Framework – more info on the slides below)
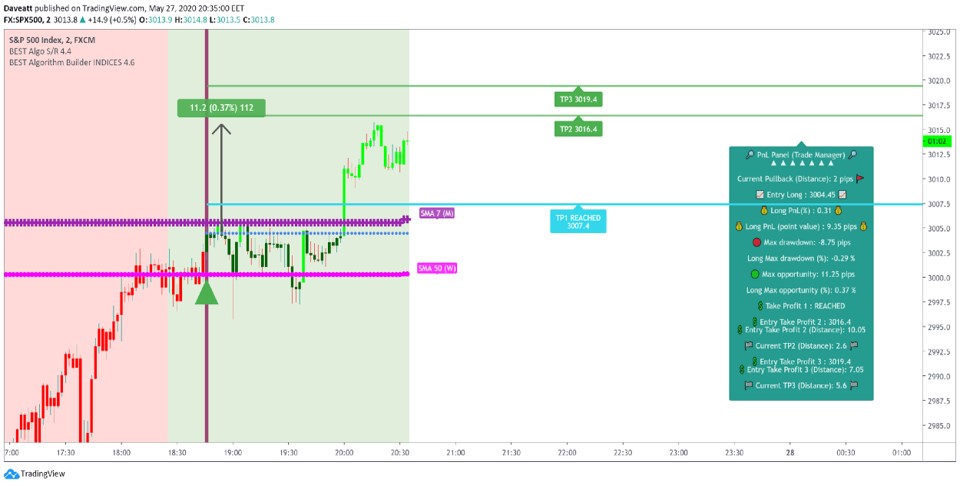
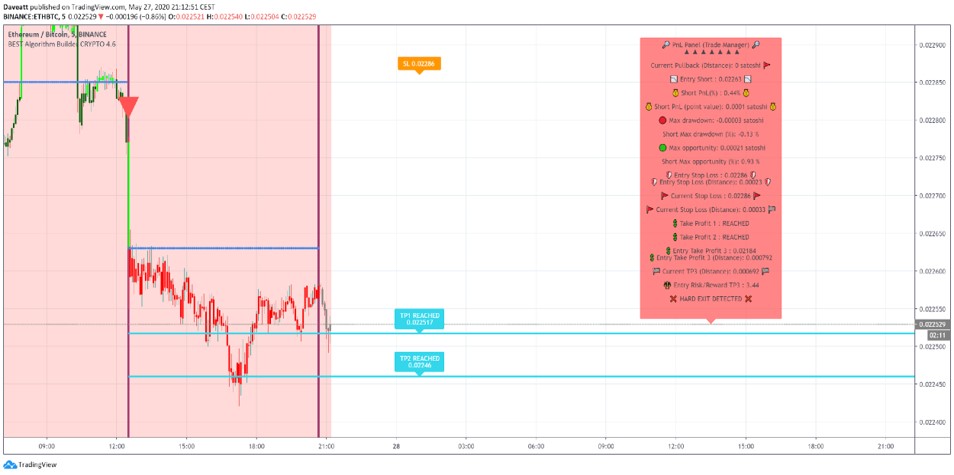
The Built-In Trade Manager : The Profit and Loss Panel
Display real-time actionable data for the current trade
- Profit and Loss in pips/points and in percentage value
- Maximum Drawdown in percentage and pips/points – measure the maximum loss for the current trade
- Maximum Opportunity in percentage and pips/points – measure the maximum opportunity/win for the current trade
- Distance in pips/points until the next Take Profit 1-2-3 price level if not reached yet
- Flag if any of the user-defined Take Profits and Stop-Loss levels have been reached
- Flag a warning if a hard-exit is detected
TRADING METHOD - The Built-In Trade Manager (Long example)
TRADING METHOD - The Built-In Trade Manager (Short example)
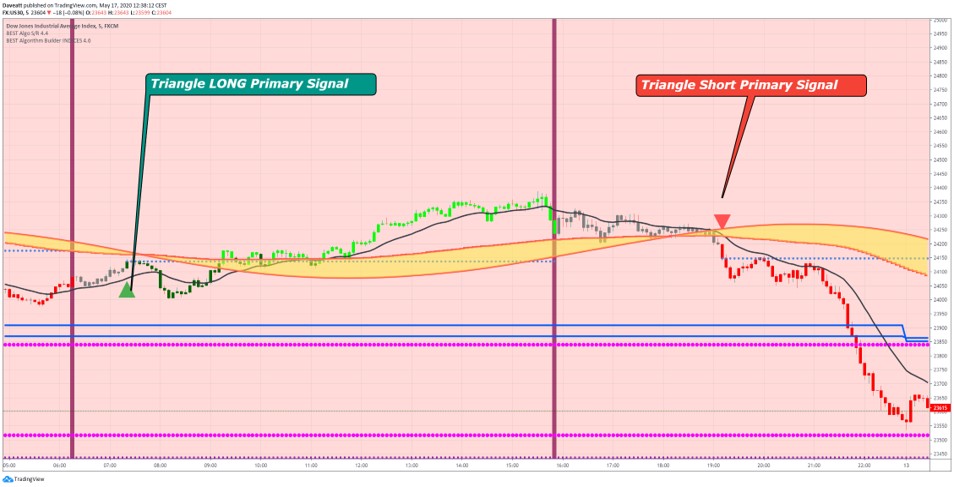
TRADING METHOD – Entries and Re-Entries (1/3)
The first entry of a trend (BULLISH or BEARISH ) is symbolized by a triangle
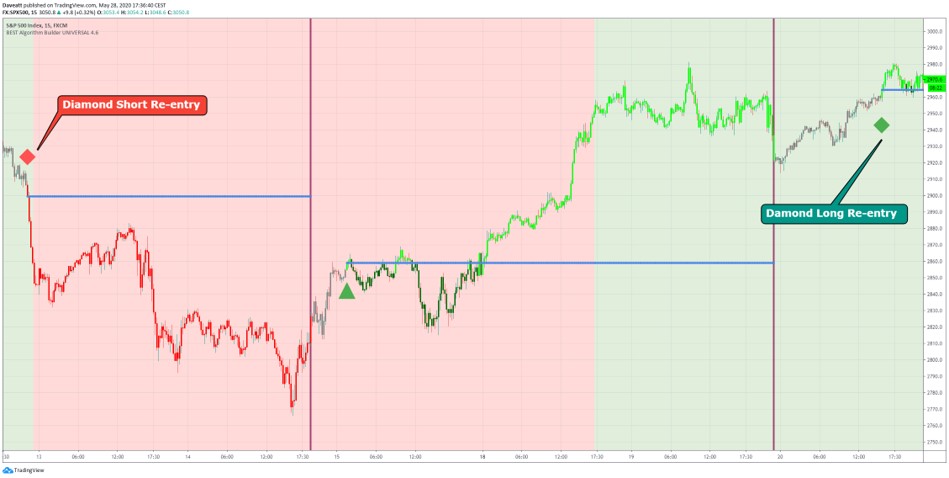
The re-entries within a trend are symbolized by diamonds with the same color as the triangle just before
We recommend having 1 opened position simultaneously only per trend per timeframe
If you get a diamond signal, but already are already in position (and not invalidated or stopped out to breakeven), we recommend not taking it
The initial entry price is plotted with a thin blue circle plot
TRADING METHOD – Entries (2/3)
TRADING METHOD – Re-Entries (3/3)
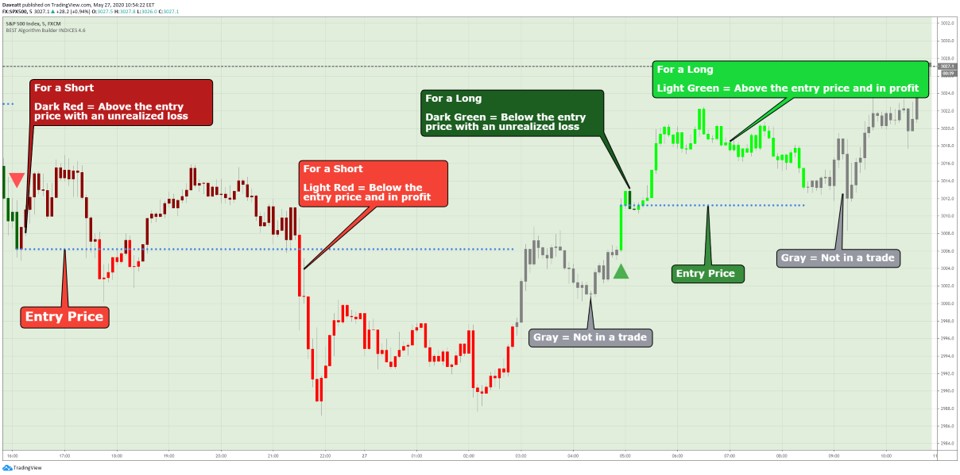
TRADING METHOD – Candles Coloring (1/2)
Activated by default but optional feature
Each color translates a different trades state
For a Long/Buy Trade:
- dark green when the candle close is below the entry price (in a loss)
- light green when the candle close is above the entry price (in a win position)
For a Short/Sell Trade:
- dark red when the candle close is above the entry price (in a loss)
- light red when the candle close is below the entry price (in a win position)
gray when not in a trade
TRADING METHOD – Candles Coloring (2/2)
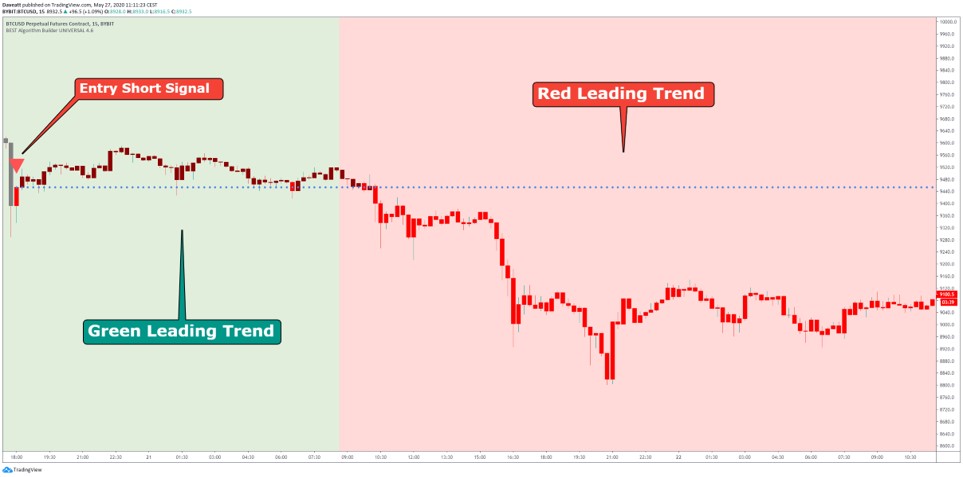
TRADING METHOD – THE LEADING TREND (1/2)
The Leading Trend is a built-in but different system
Displays the Trend direction from a much bigger timeframe on your TradingView charts
Activated by default, each color translates a different bigger trend direction
By default, the colors are as follow :
- Green if bullish
- Red if bearish
TRADING METHOD – THE LEADING TREND (2/2)
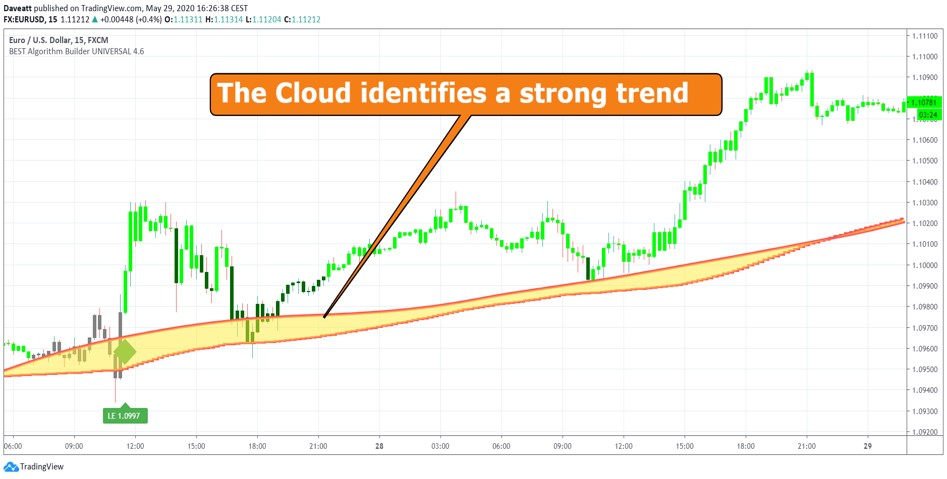
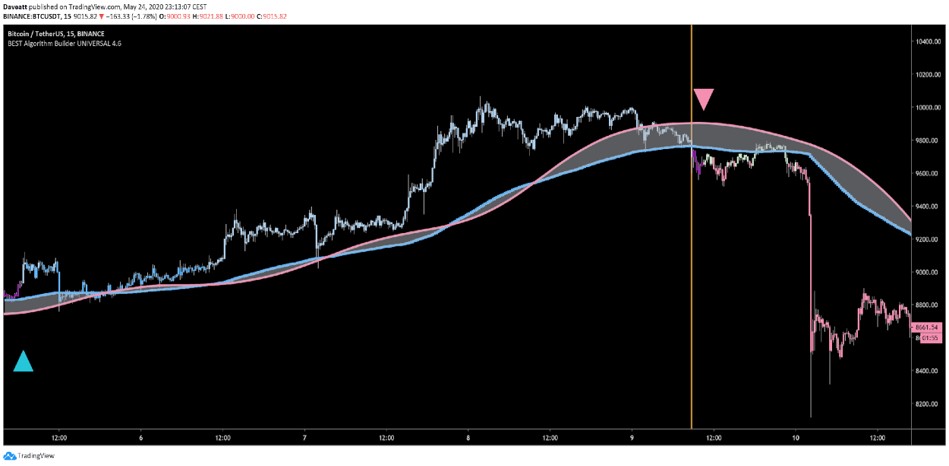
TRADING METHOD – THE CLOUD (1/2)
The Cloud is our Custom Trend identifier
We made it such as to identify strong trends and “risk” zones In other words, identify if a trend is likely to continue further or reverse
TRADING METHOD – THE CLOUD (2/2)
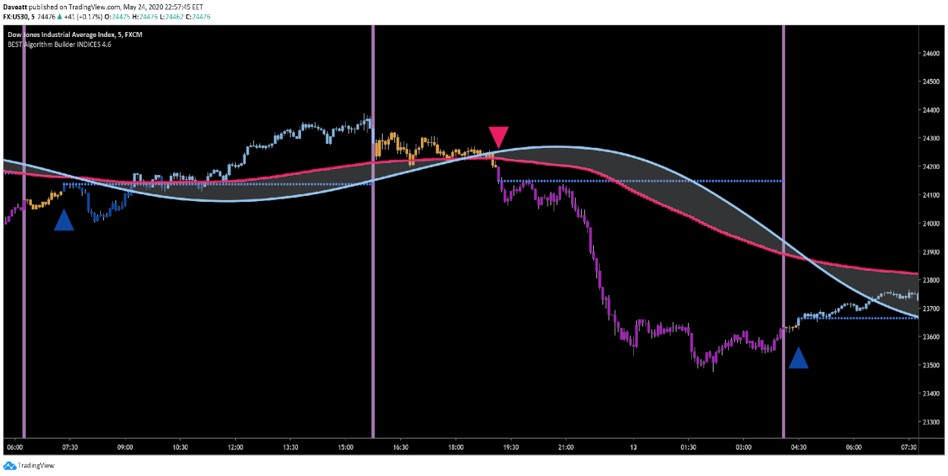
TRADING METHOD – The EXIT process – Hard Exit (1/3)
We ditched the Stop-Loss based on price or percentage level because it’s not working
- We needed a way to get stopped-out because the trade is wrong (and not getting stopped-out because of slippage or bad analysis).
- We selected an algorithmic method as it’s a much smarter and efficient way to exit a trade when invalidated
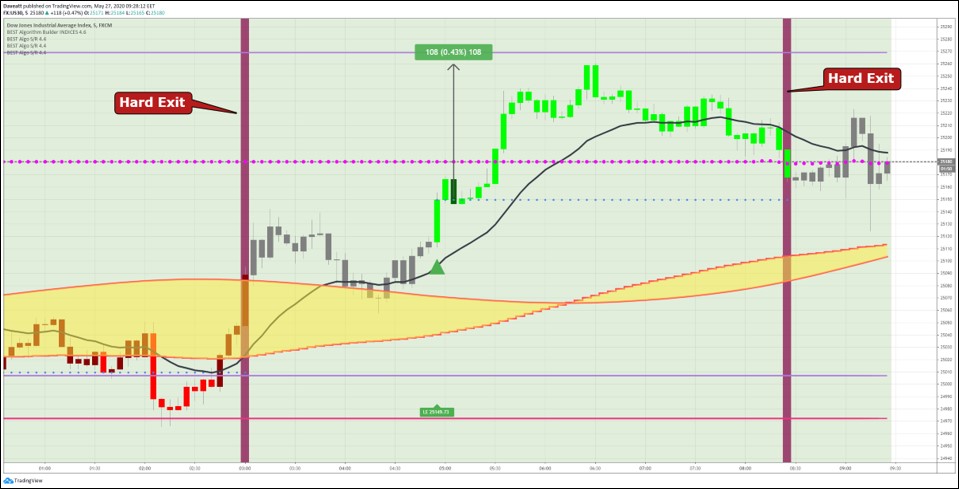
Instead, we use our custom Stop-Loss called “Hard-Exit” and is a KEY component of our Trading Method
This is our algorithmic way of warning our subscribers that they MUST exit the trade no matter what they think-feel-want
We made a unique Hard-Exit per Framework ensuring our subscribers the losses being minimal the vast majority of the times
Symbolized by a brown vertical line , the “Hard-Exit” is an important signal warning the trader to exit as a reverse may likely happen
TRADING METHOD – The EXIT process – Hard Exit (2/3)
Q: What’s behind the hard-exit?
Hard-Exit or Hard-Stop are common terms in trading
They refer to exiting a position based on technical indicators (and not based on price value).
When those indicators are all giving contrary signals, the system displays and alerts us with a brown vertical bar (see next slide).
Contrary means for instance, we’re on a LONG trade, and then all the hard-exit indicators become bearish flagging a potential incoming reverse
Q: How to evaluate the Risk-To-Reward from our trades then?
This metric is very subjective. Because you could evaluate a RISK=1 and a REWARD=10 but that doesn’t mean your analysis is correct and not bias.
We made this exit system to lower as much as possible the losses (=invalidations) and stand by our assessment that capturing hundreds of pips a day, regardless of the asset class, is doable.
This level of abstraction allows our traders to have a stronger focus on their trades .
Because they know that, if invalidated, their losses should be minimal relative to the rewards to be captured during the day.
TRADING METHOD – The EXIT process – Hard Exit (3/3)
TRADING METHOD – The EXIT process – Take Profit Levels (1/2)
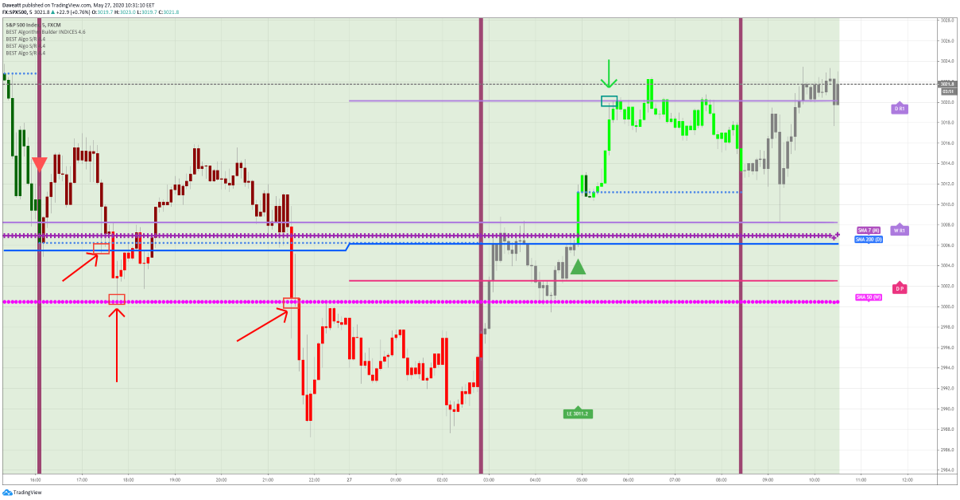
The Take-Profit levels are based on Algorithmic Multi-timeframes Supports and Resistances
You won’t have to draw <>any trendline or pattern or add any other indicator Our Method is complete and cover all scenarios to either exit with a small loss or taking-profit
Over the years, we found for each asset class and timeframe, the most relevant supports and resistances to be used as take-profit levels
Because the candles often bounce on them, we selected specific Moving Averages and Pivots for our Take Profit strategy
TRADING METHOD – The EXIT process – Take Profit Levels (2/2)
Part II - General Guidelines (Supports/Resistances)
Script included for FREE for all our VIP subscribers
Please Have in mind how to use the SMAs/EMAs and Traditional Pivots from our Algorithmic Supports and Resistances TradingView script.
A simple moving average (SMA) is an arithmetic moving average calculated by adding recent closing prices and then dividing that by the number of time periods in the calculation average
A pivot point is a technical analysis indicator, or calculations, used to determine the overall trend of the market over different time frame
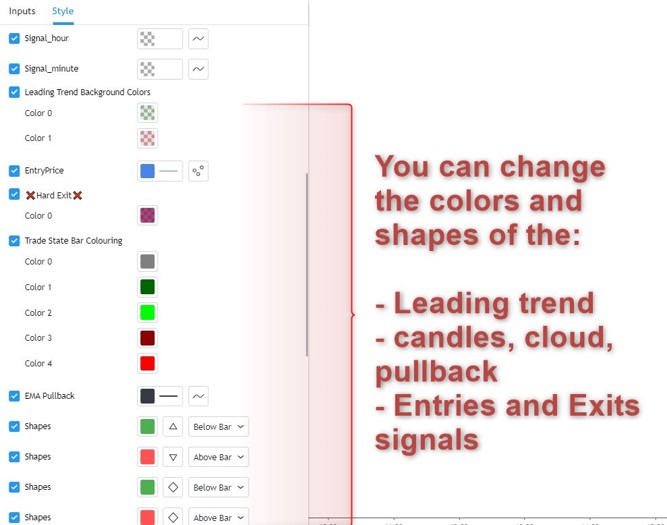
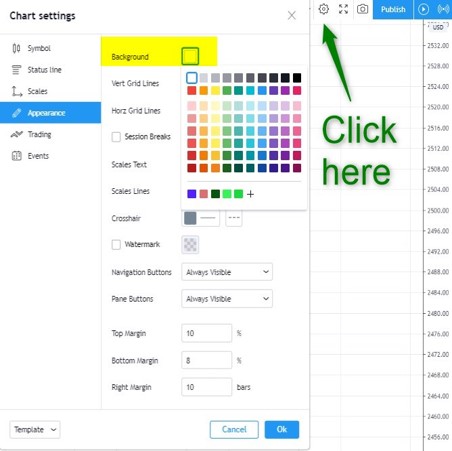
Part III - To change the signals and the background colors (1/5)
Keep in mind we’ll always refer to Green/Red signals and Green/Red leading trend
Though, you can change those colors if you fancy more colorful ones
For doing so,Double Left-Click on the Indicator name thengo to the Style Tab.
Part III - To change the chart background colors (3/5)
Part III - Example (4/5)
Part III - Example (5/5)
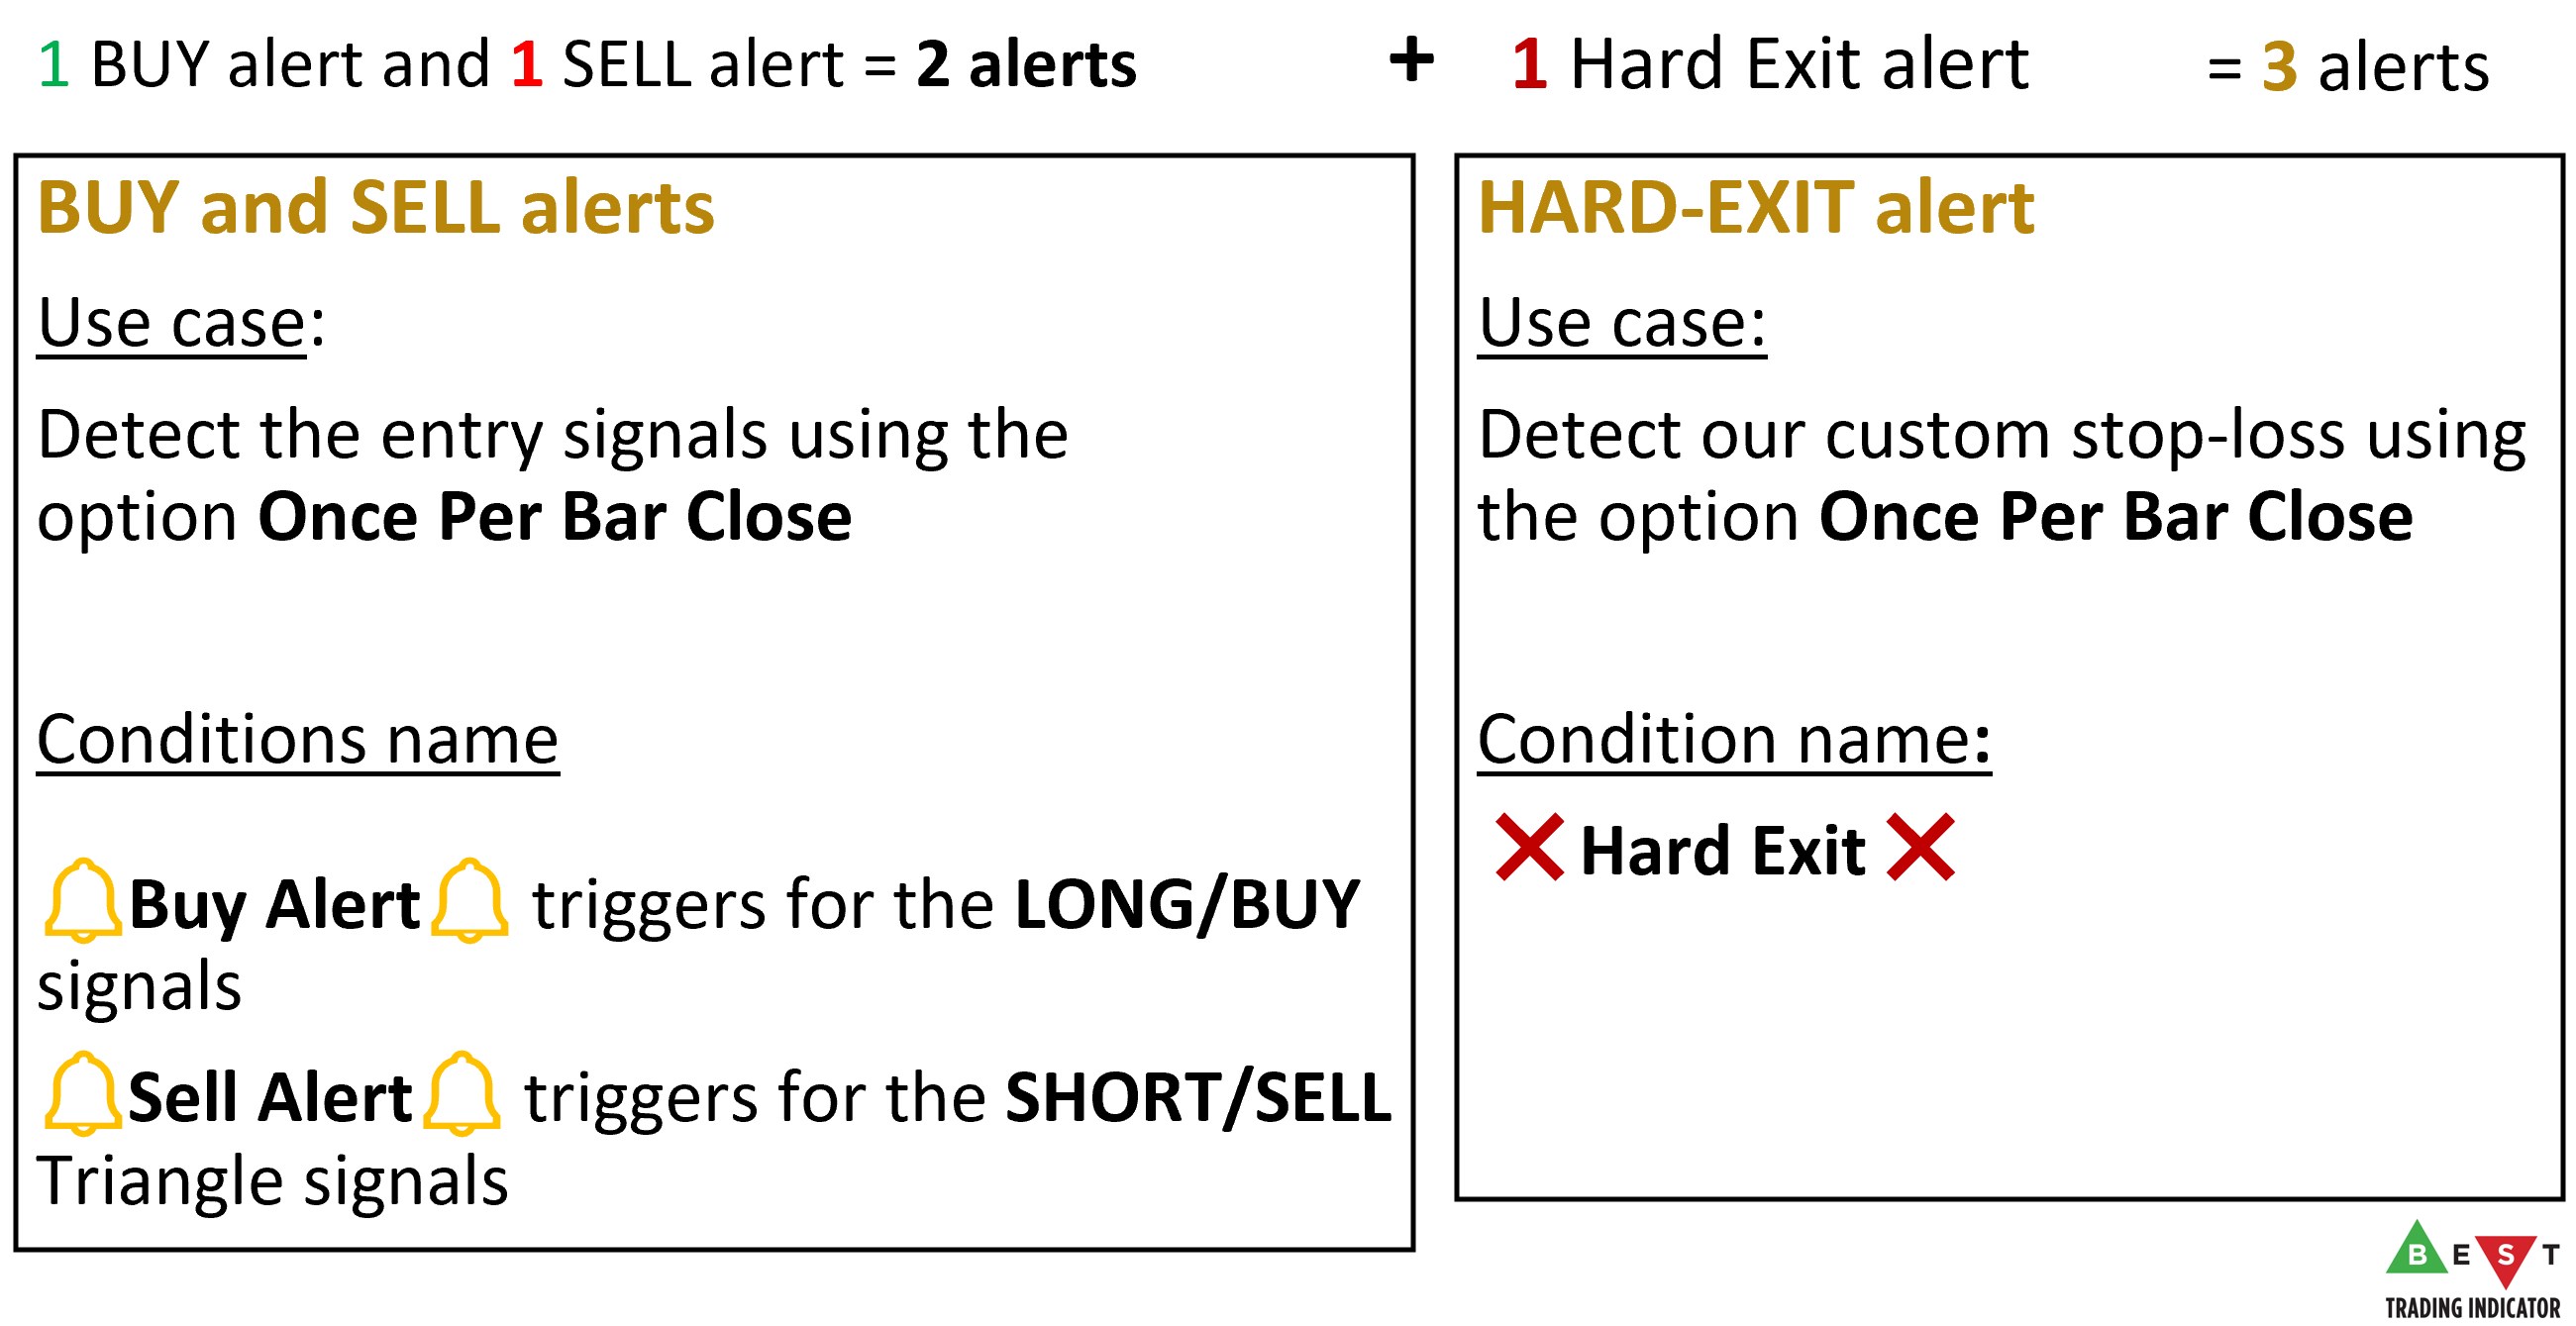
Part III - Setting-up your TradingView server-side alerts (1/3)
How many alerts per asset class?
We recommend 3 alerts per asset/instrument per timeframe per Algorithm builder
OR, you can create 1 alert per asset/timeframe with the condition Consolidated on Bar Close capturing any BUY/SELL/HARD EXIT events
More info available from our Forum
How many server-side alerts per TradingView account?
- TradingView Free: 1
- TradingView Pro: 10
- TradingView Pro+: 30
- TradingView Premium: 400
Part III - Setting-up your TradingView server-side alerts (2/3)
AFFILIATION
Make 30% recurring per subscription period for your referees
- Month for a Monthly subscriber
- Quarter for a 3-Months subscriber
- Year for a 12-Months subscriber
You can generate really good passive income with more than 1 referee.
Get access to your Affiliate Dashboard tracking which of your friends clicked on your tracking link and subscribed
Tutorial : https://best-trading-indicator.com/pages/affiliate-program
Affiliation Platform: https://best-trading-indicator.goaffpro.com
APPENDICES
Our Public chatroom is on Discord: https://discord.gg/fcEFRpC
Our Testimonials and Reviews page
Our recent Shared Public Trades Results and Performance based on the BEST Trading Method and TradingView scripts
We’re active on Twitter and we’ll beery grateful if you give us a follow :)