
Pricing plans and indicator
Moving Average Convergence Divergence (MACD) is a trend-following momentum indicator that shows the relationship between two moving averages of a security’s price. The MACD is calculated by subtracting the 26-period Exponential Moving Average (EMA) from the 12-period EMA.
Having characteristics of both leading and lagging indicators, along with a moving average trigger line, the MACD presents the kind of versatility and multifunctionality traders are looking for.
When the EMA-9 crosses above the MACD(12,26), this is considered a bearish signal. It means the trend in the stock – its magnitude and/or momentum – is starting to shift course. When the MACD(12,26) crosses above the EMA-9, this is considered a bullish signal.
Crypto Signals of the day
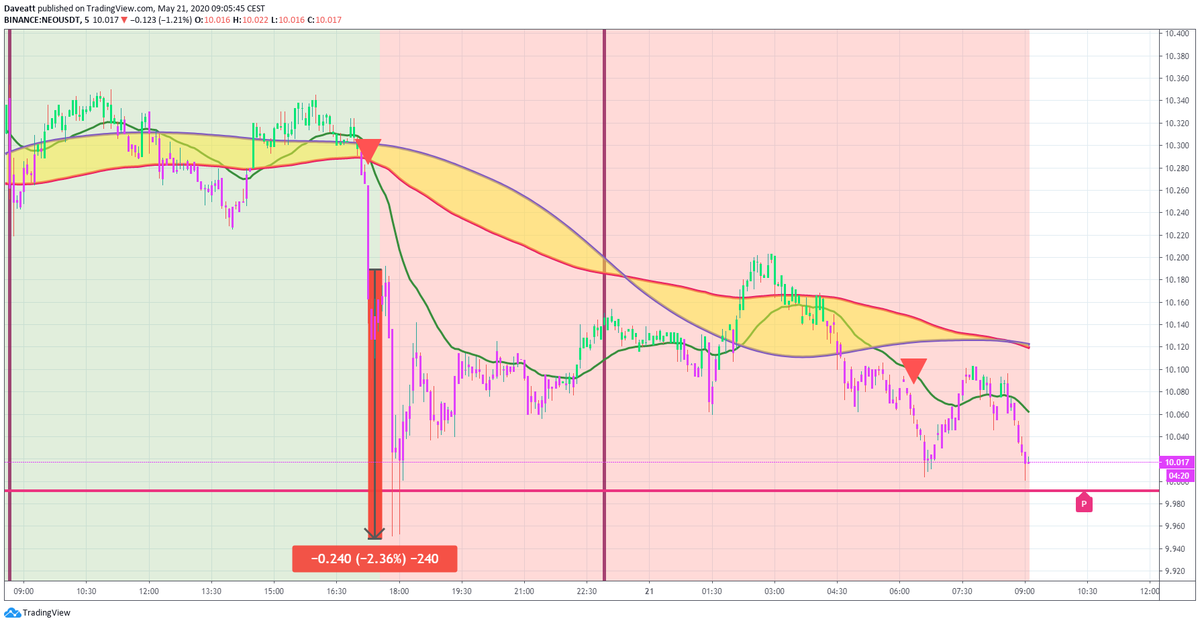
EOS NEO BNB
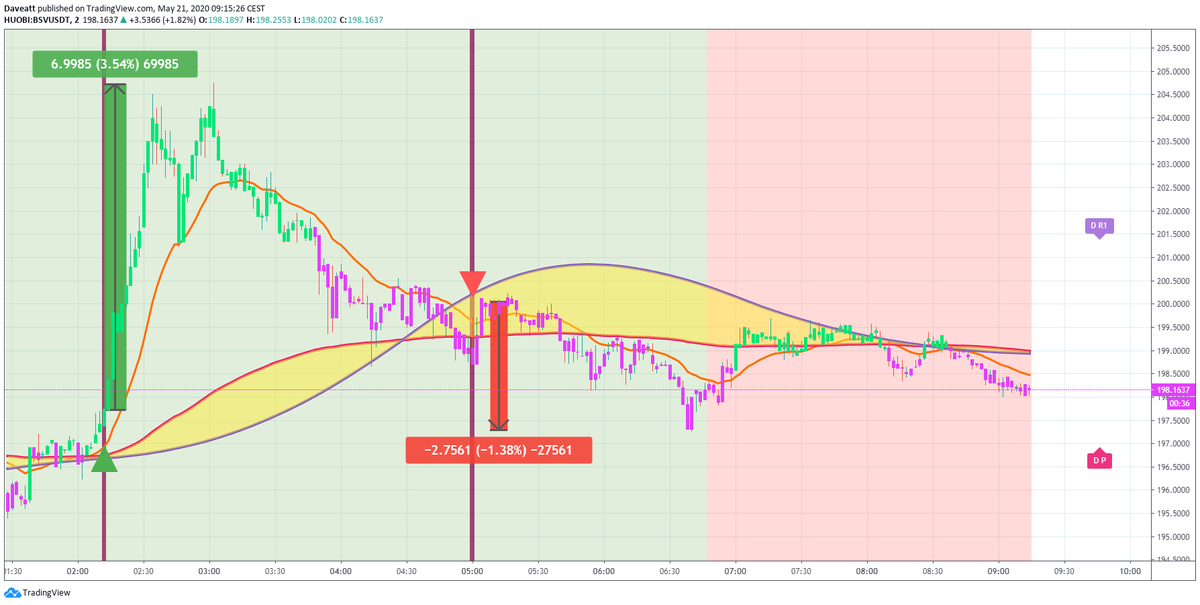
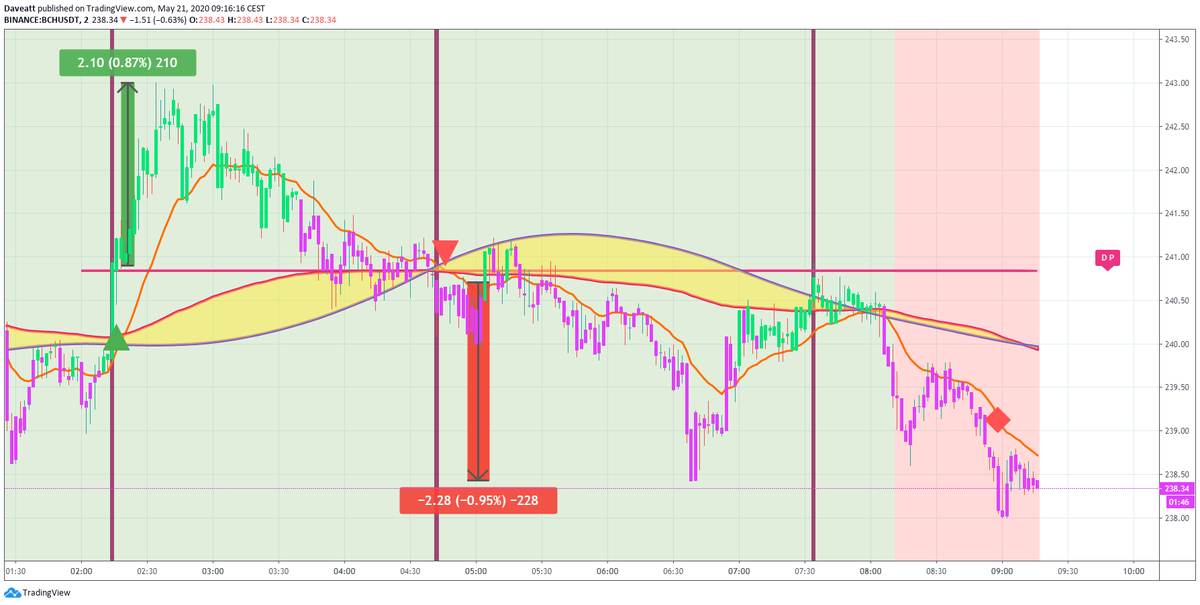
ADA BSV BCH

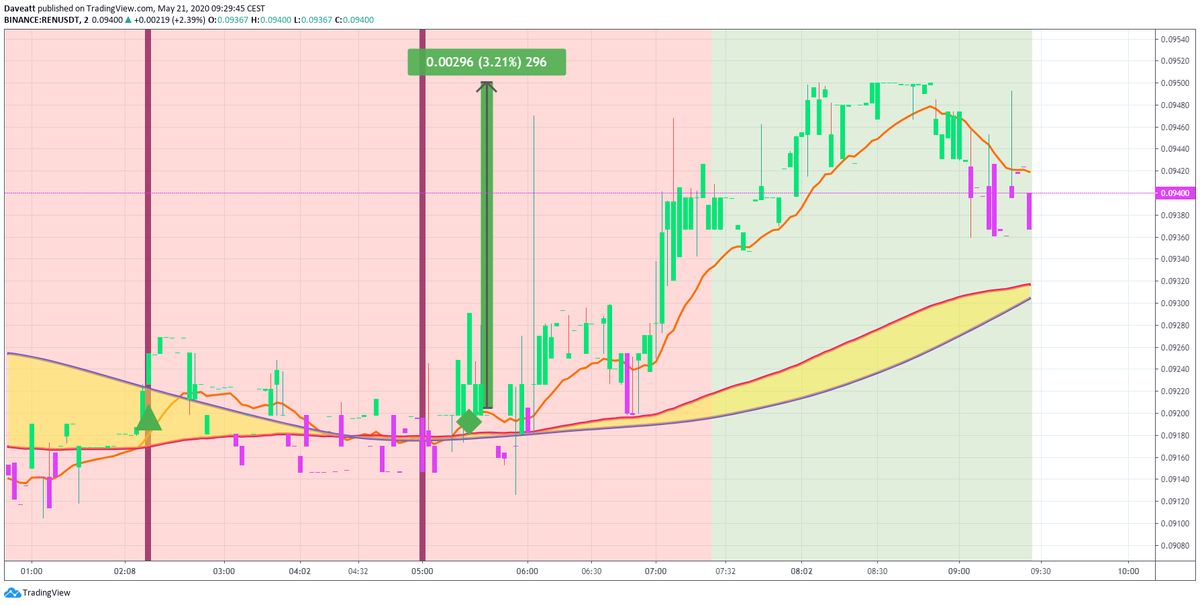
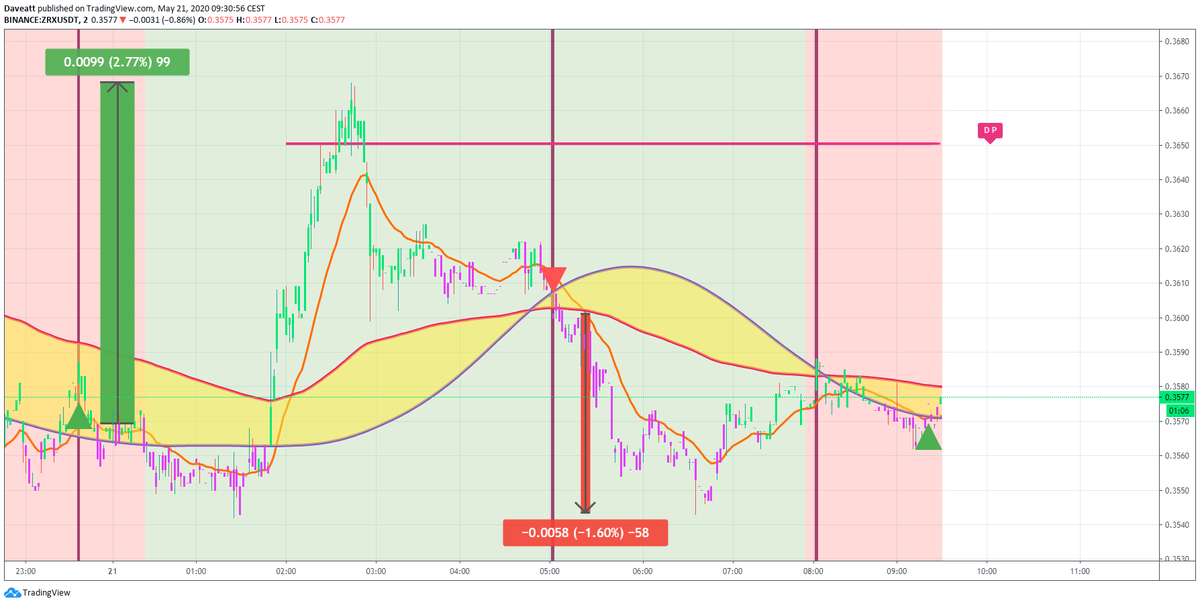
ETN REN ZRX
Electroneum Ren Ox

Trading bot crypto signals
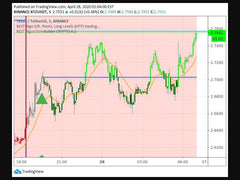
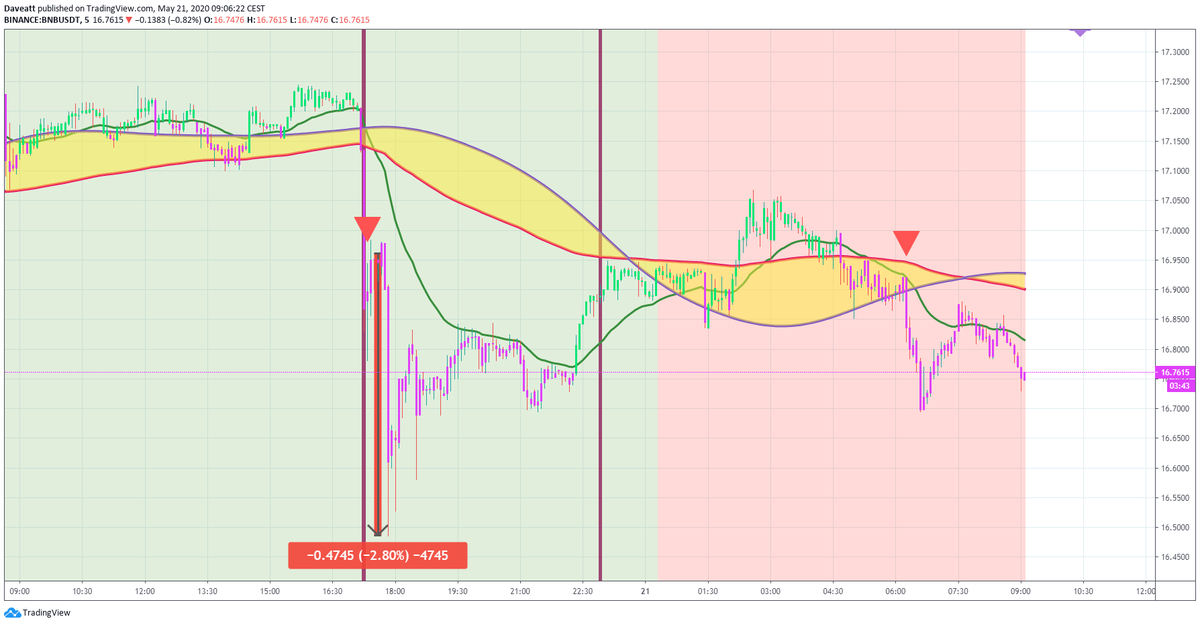
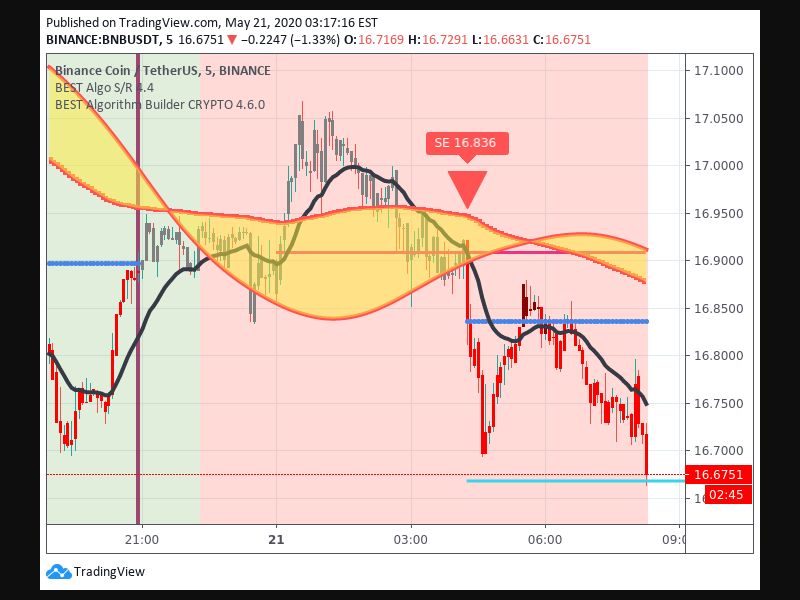
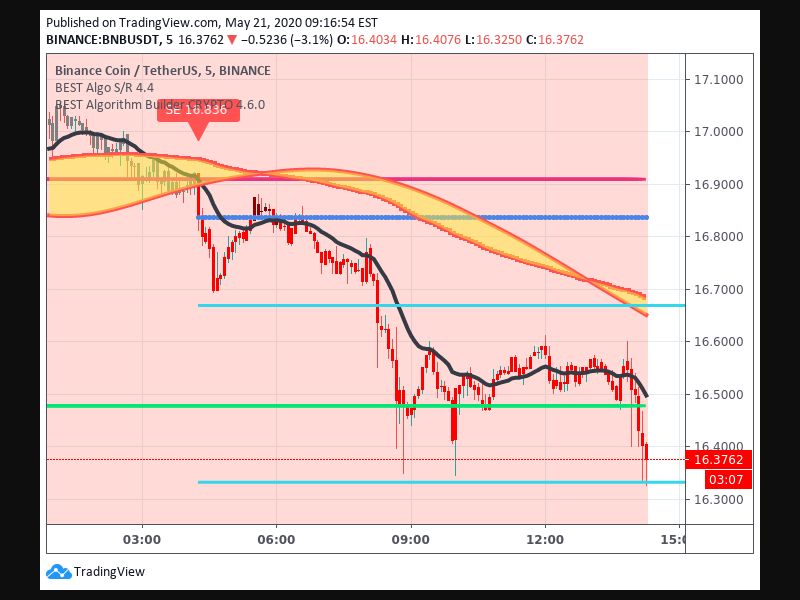
BINANCE:BNBUSDT
Asset: Binance Coin
Direction: Short
Timeframe: 5
TP1 price: 16.6676
Pips gained: 0.1690000000000005
Percentage move: 1%
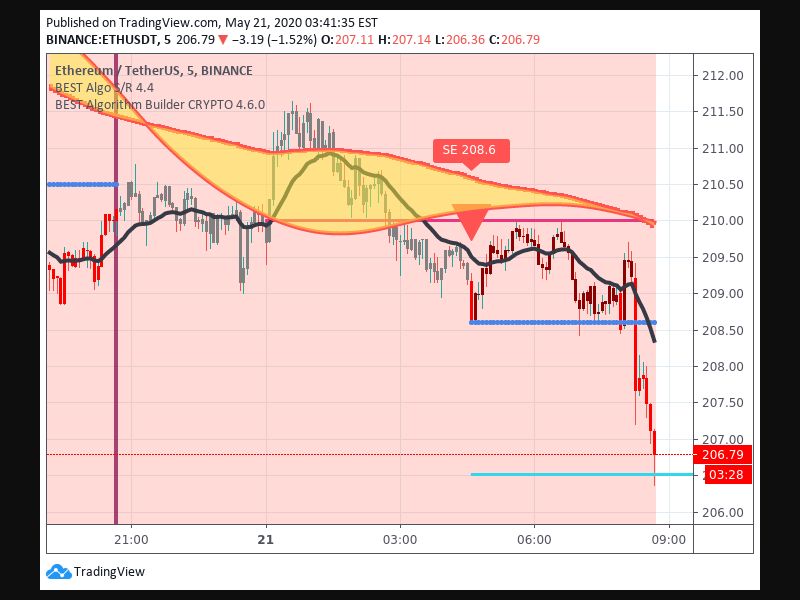
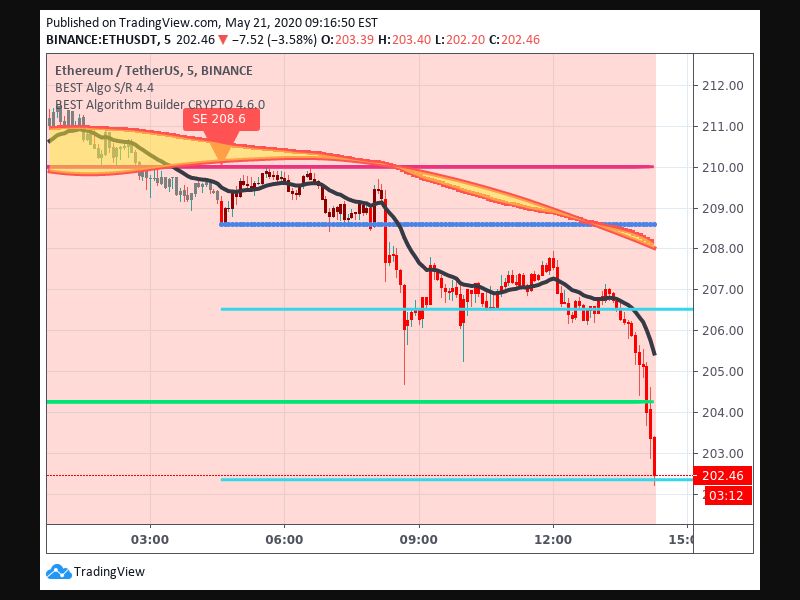
ETHUSDT/Ethereum
Direction: Short
Timeframe: 5
TP1 price:206.51
Pips gained:2.1000000000000227
Percentage move:1.01%
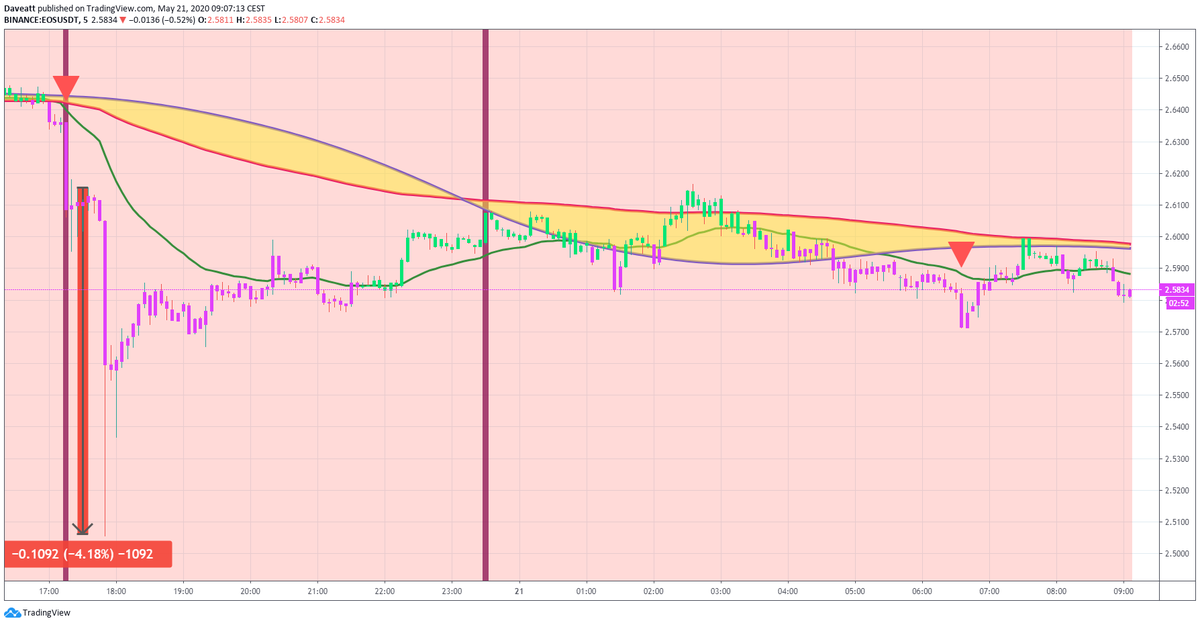
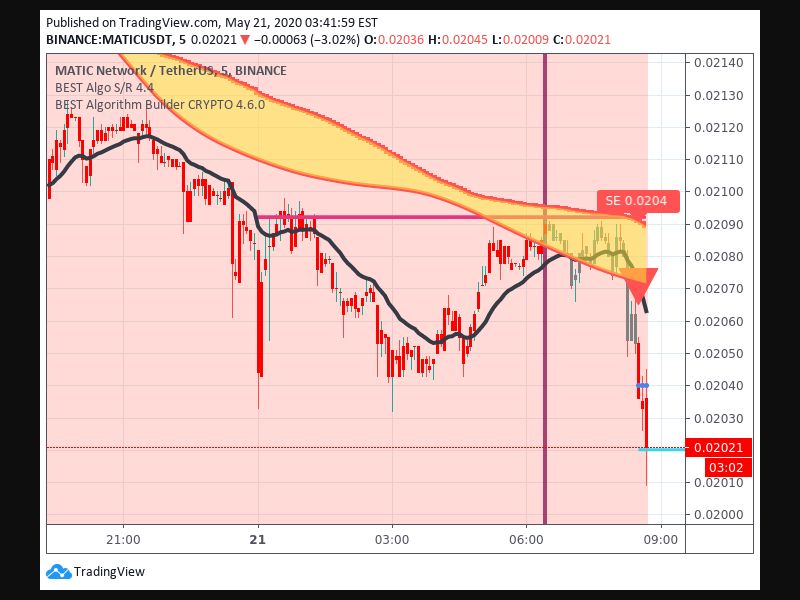
MATIC
Direction: Short
Timeframe: 5
TP1 price: 0.0202
Pips gained: 0.0003
Percentage move: 1.47%
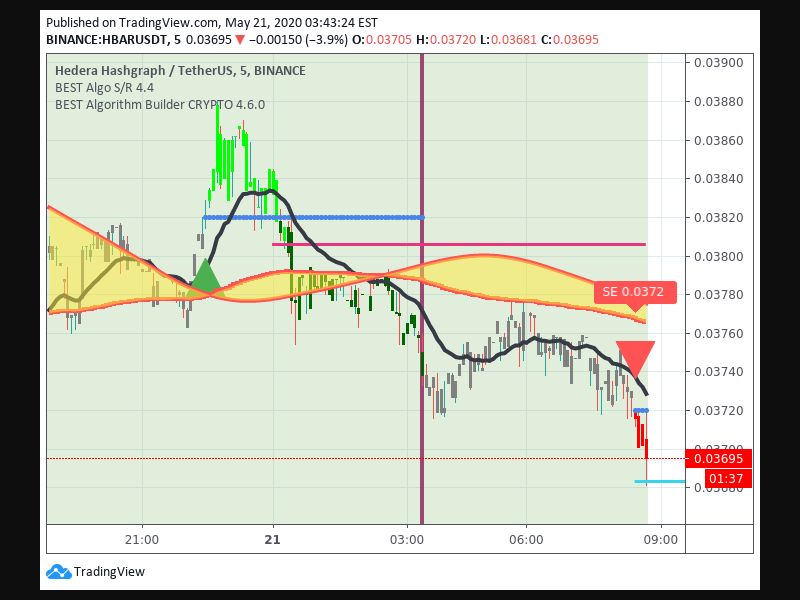
Hedera Hashgraph
Direction: Short
Timeframe: 5
TP1 price :0.03683
Pips gained: 0.0004
Percentage move: 1.08%
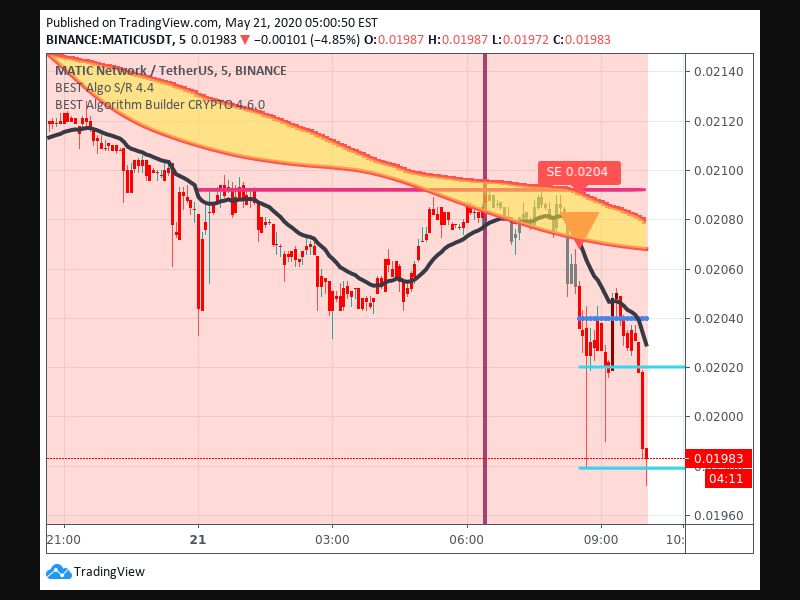
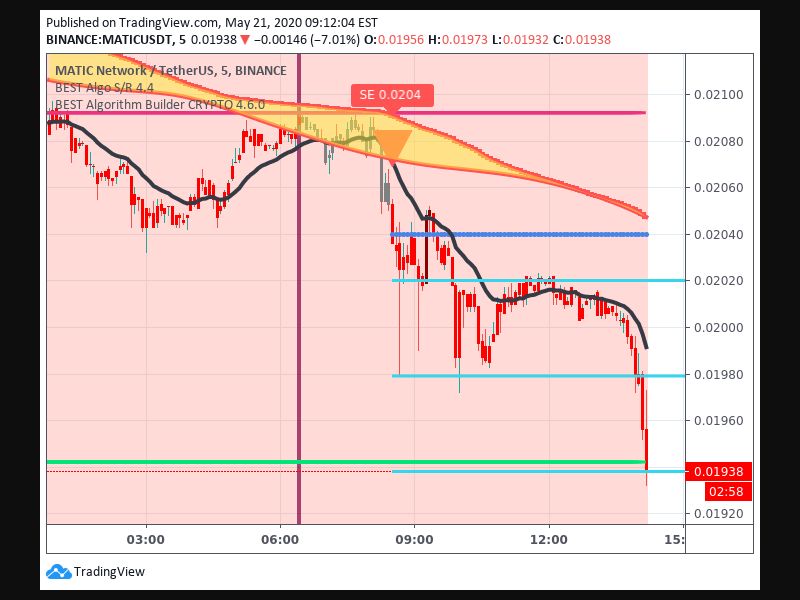
MATIC
Direction: Short
Timeframe: 5
TP2 price :0.01938
Pips gained: 0.0007
Percentage move: 3.43%
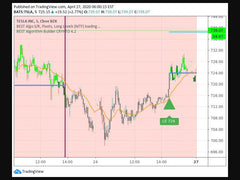
TRX IOTA FTT

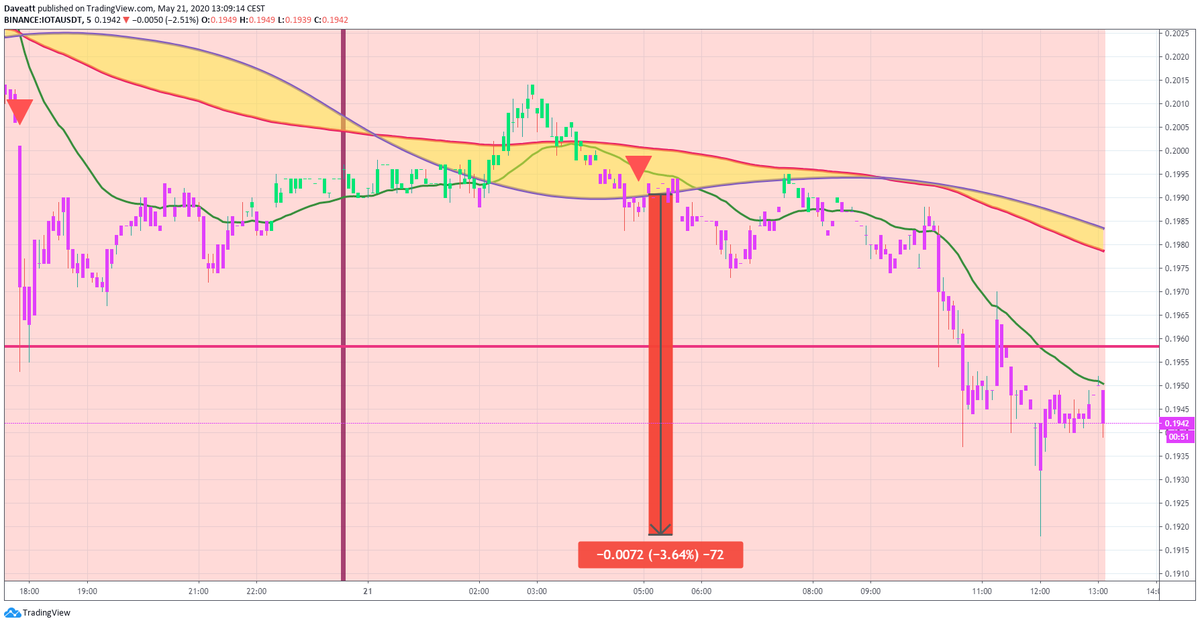
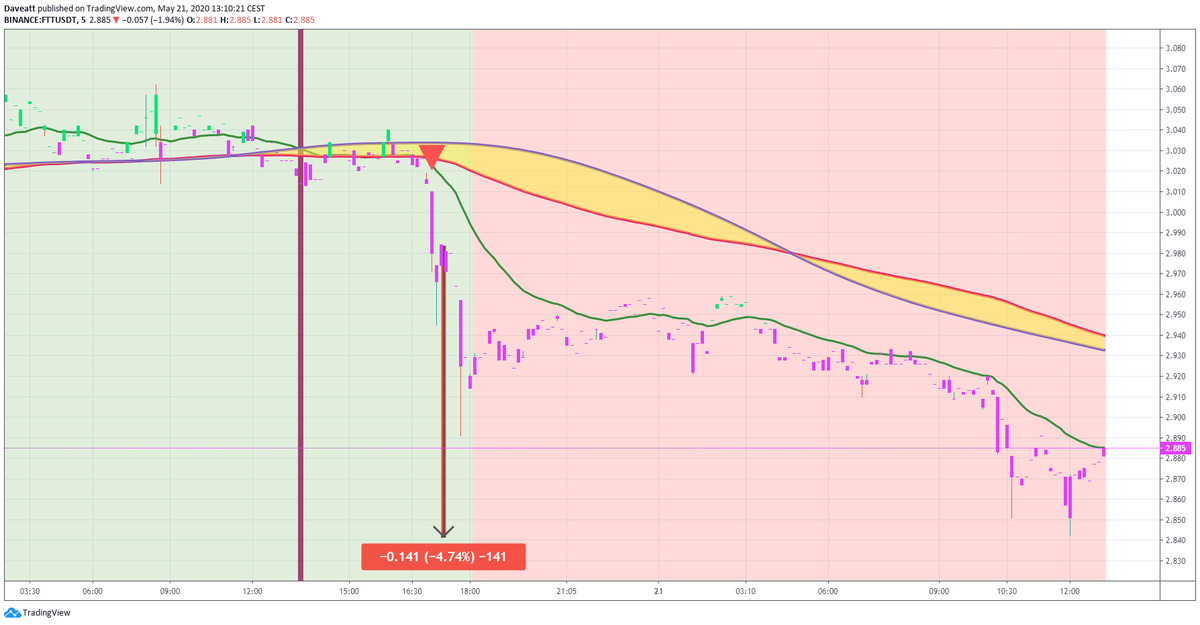
Matic Third Take Profit
Direction: Short Timeframe: 5 TP3
price :0.01938
Pips gained: 0.0011
Percentage move: 5.39% $BITCOIN
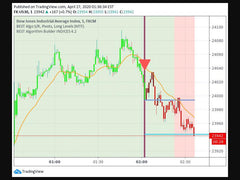
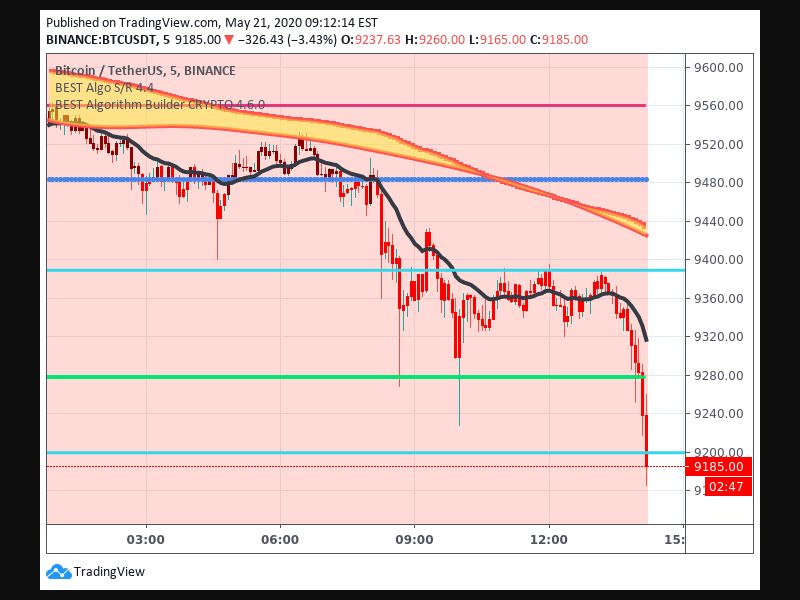
Bitcoin (BTCUSDT on Binance)
Direction: Short
Timeframe: 5
TP2 price:9198.9
Pips gained:284.89999999999964
Percentage move:3% $BITCOIN
Ethereum ETHUSDT
BNBUSDT
Hedera Hashgraph

Related Posts