Pricing plans and indicator
The Stochastic Indicator
The Stochastic Oscillator (STOCH) is a range bound momentum oscillator. The Stochastic indicator is designed to display the location of the close compared to the high/low range over a user-defined number of periods. Typically, the Stochastic Oscillator is used for three things; Identifying overbought and oversold levels, spotting divergences, and also identifying bull and bear set-ups or signals.
he Stochastics Oscillator is a range-bound oscillator consisting of two lines that move between 0 and 100. The first line (known as %K) displays the current close in relation to a user-defined period's high/low range. The second line (known as %D) is a simple moving average of the %K line. Now, as with most indicators, all of the periods used within Stochastic can be user-defined. That being said, the most common choices are a 14 period %K and a 3 period SMA for %D.
The basic understanding is that Stochastic uses closing prices to determine momentum. When prices close in the upper half of the look-back period's high/low range, then the Stochastic Oscillator (%K) rises also indicating an increase in momentum or buying/selling pressure. When prices close in the lower half of the period's high/low range, %K falls, indicating weakening momentum or buying/selling pressure.
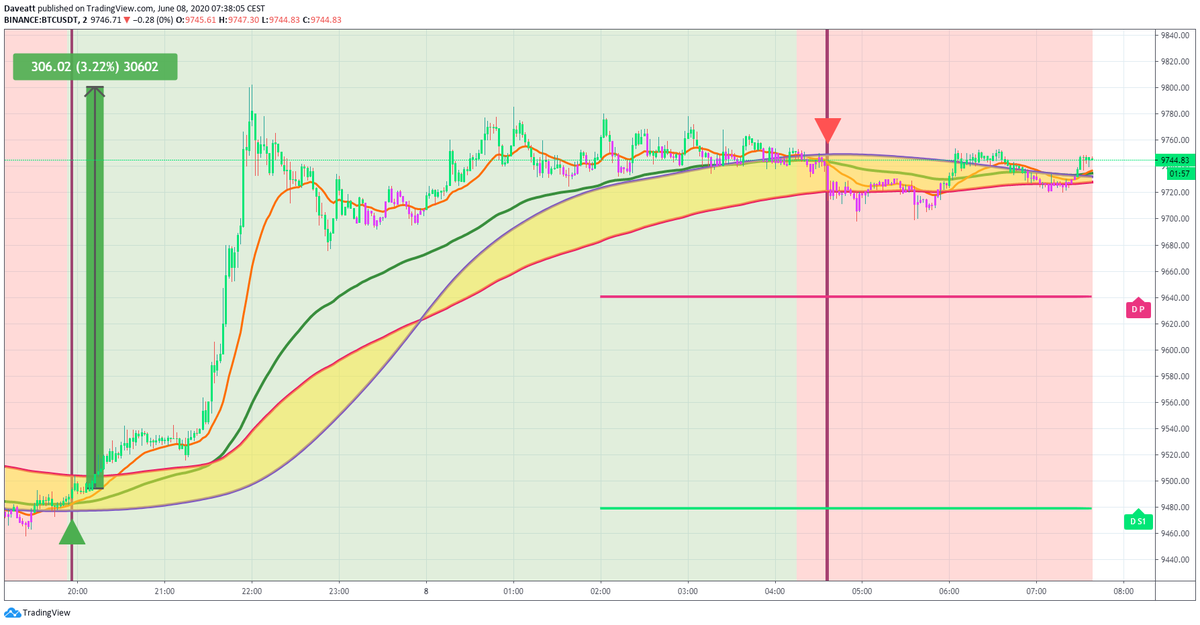
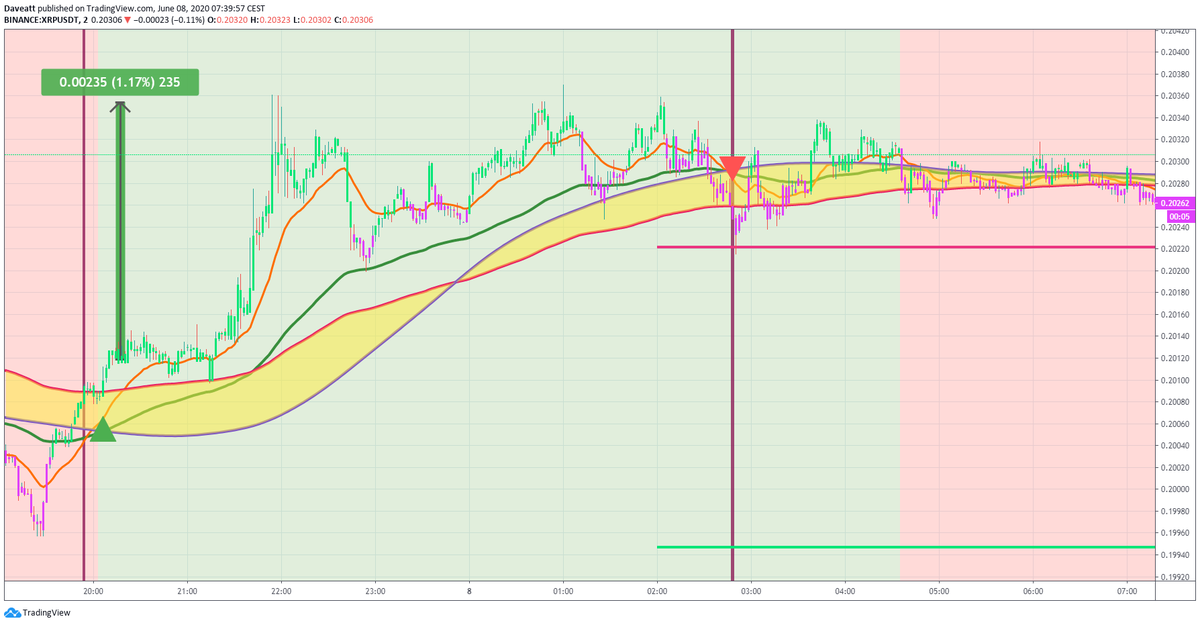
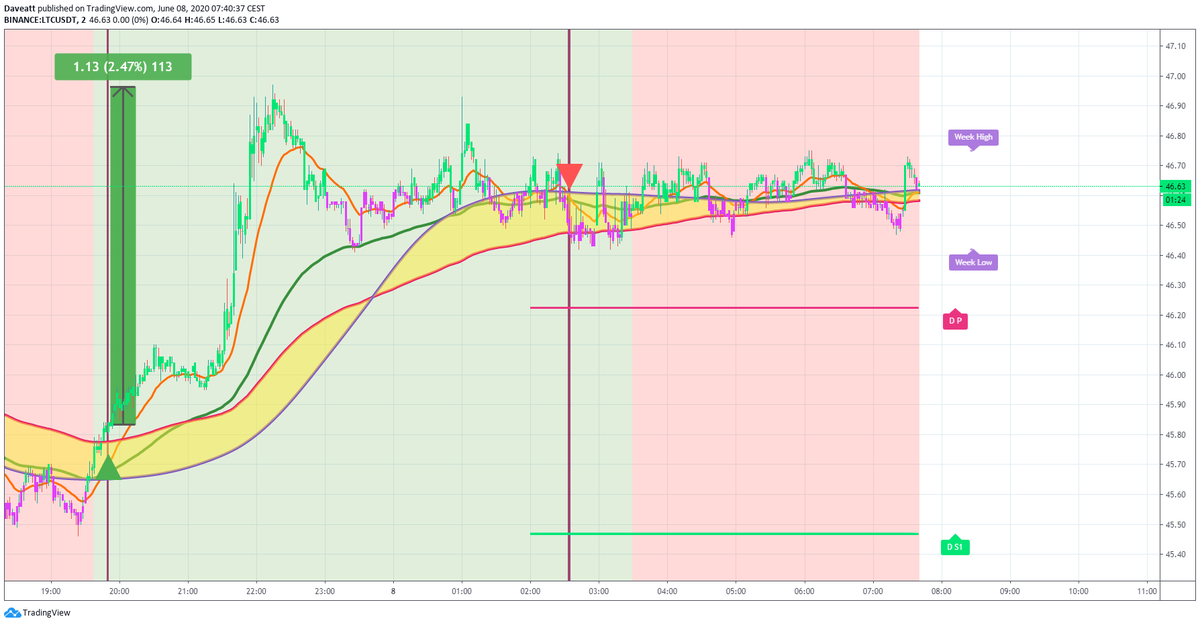
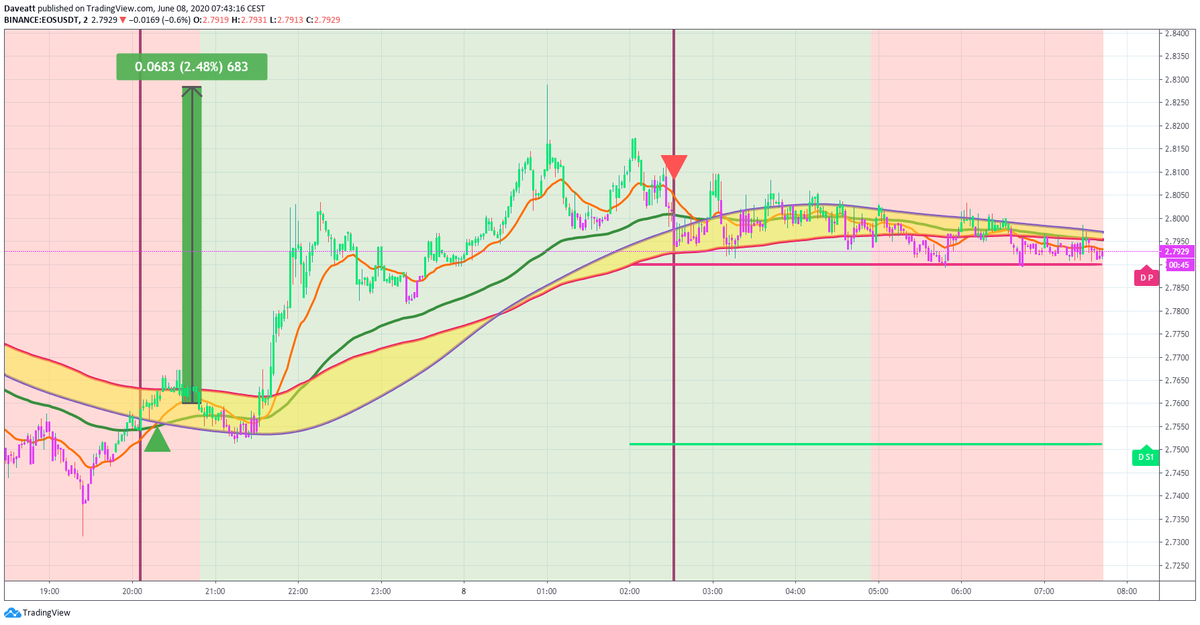
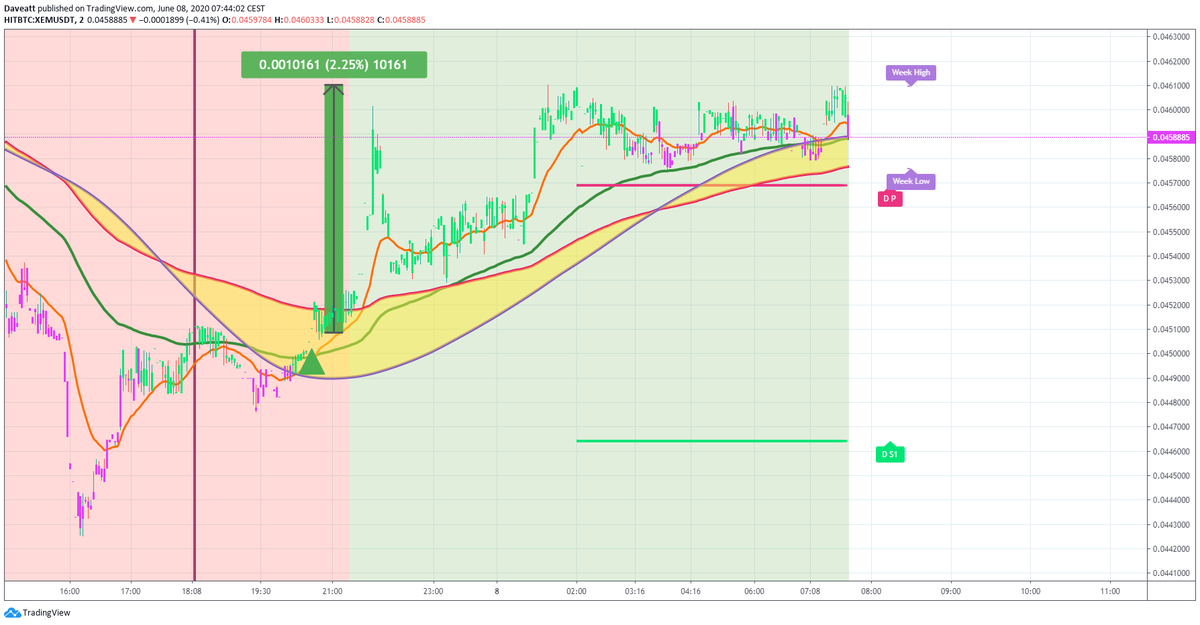
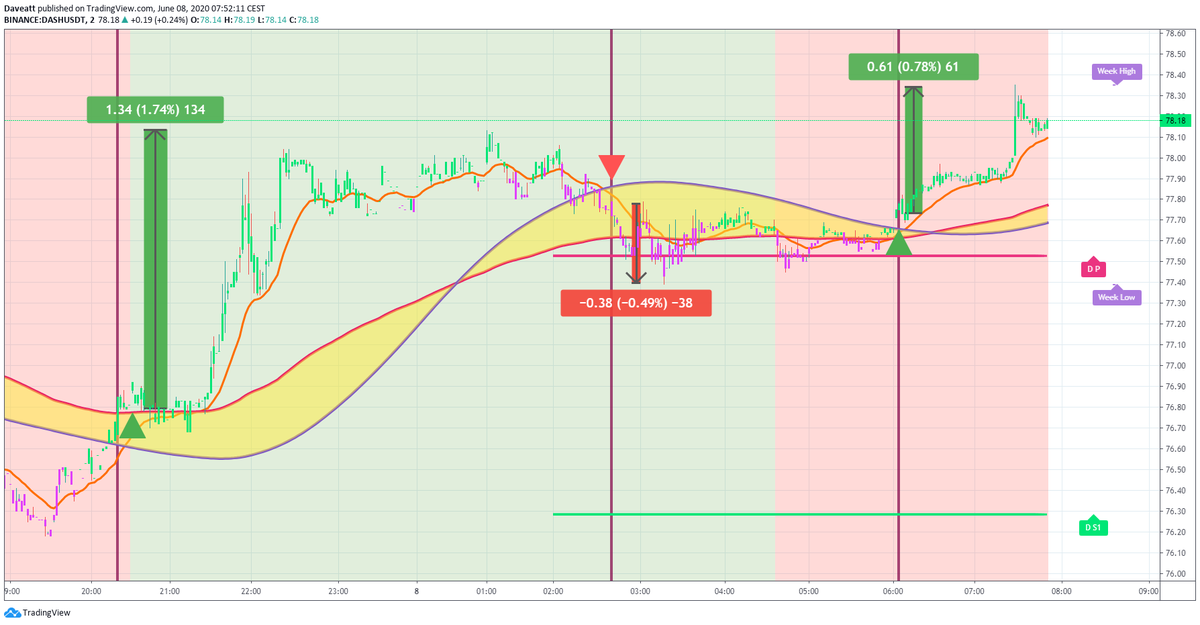
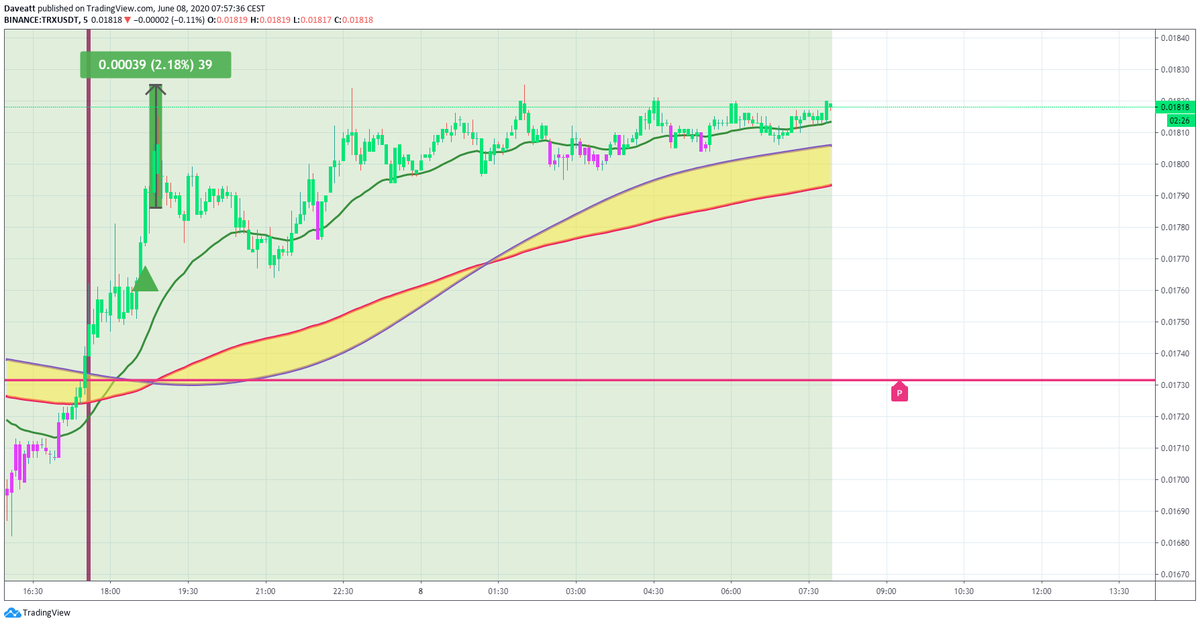
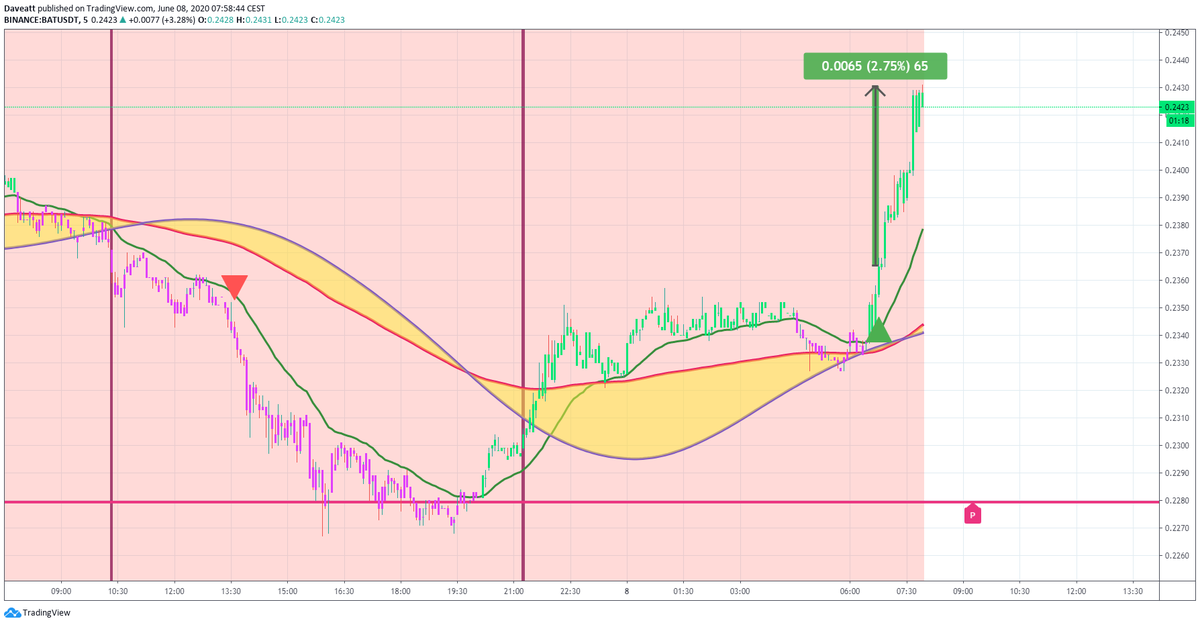
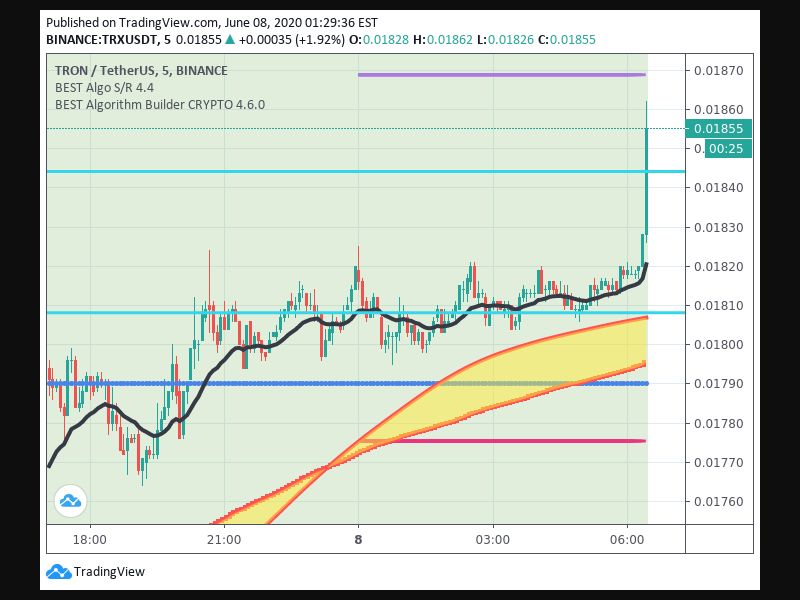
We're trading cryptocurrencies coins with the Algo Builder Crypto Intraday 5-minutes and Algo Builder Universal 15-minutes
A quite note
Each screenshot below is clickable and can be enlarged for better visibility


