
Pricing plans and indicator
What is the Commodity Channel Index?
The Commodity Channel Index (CCI) is a momentum oscillator used in technical analysis primarily to identify overbought and oversold levels by measuring an instrument's variations away from its statistical mean. CCI is a very well-known and widely-used indicator that has gained a level of popularity in no small part of its versatility. Besides overbought/oversold levels, CCI is often used to find reversals as well as divergences. Originally, the indicator was designed to be used for identifying trends in commodities, however, it is now used in a wide range of financial instruments.
The Commodity Channel Index indicator takes a security change in price and compares that to its average change in price. CCI's calculation produces positive and negative values that oscillate above and below a Zero Line. Typically a value of 100 is identified as overbought and a reading of -100 is identified as being oversold. However, it is important to note a couple of things.
- Actual overbought and oversold thresholds can vary depending on the financial instrument being traded. For example, a more volatile instrument may have thresholds at 200 and -200.
- Frequently, overbought/oversold conditions are seen as a precursor to a price reversal. However, when using CCI, overbought and oversold conditions can often be a sign of strength, meaning the current trend may be strengthening and continuing.
A quite note
Each screenshot below is clickable and can be enlarged for better visibility
Crypto Trades
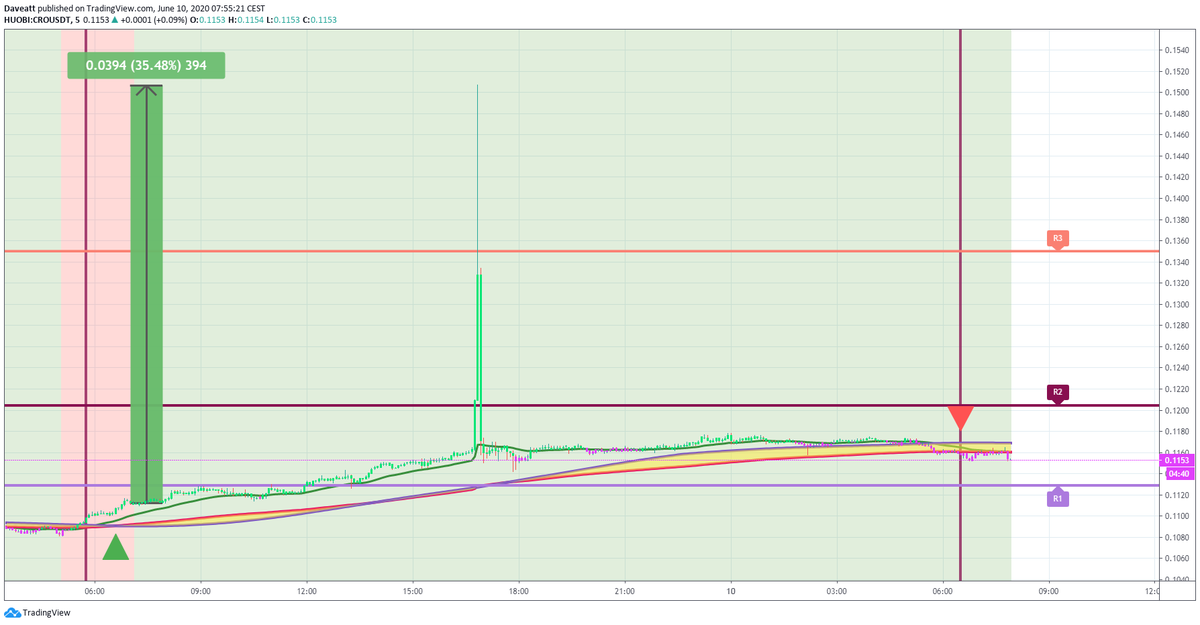
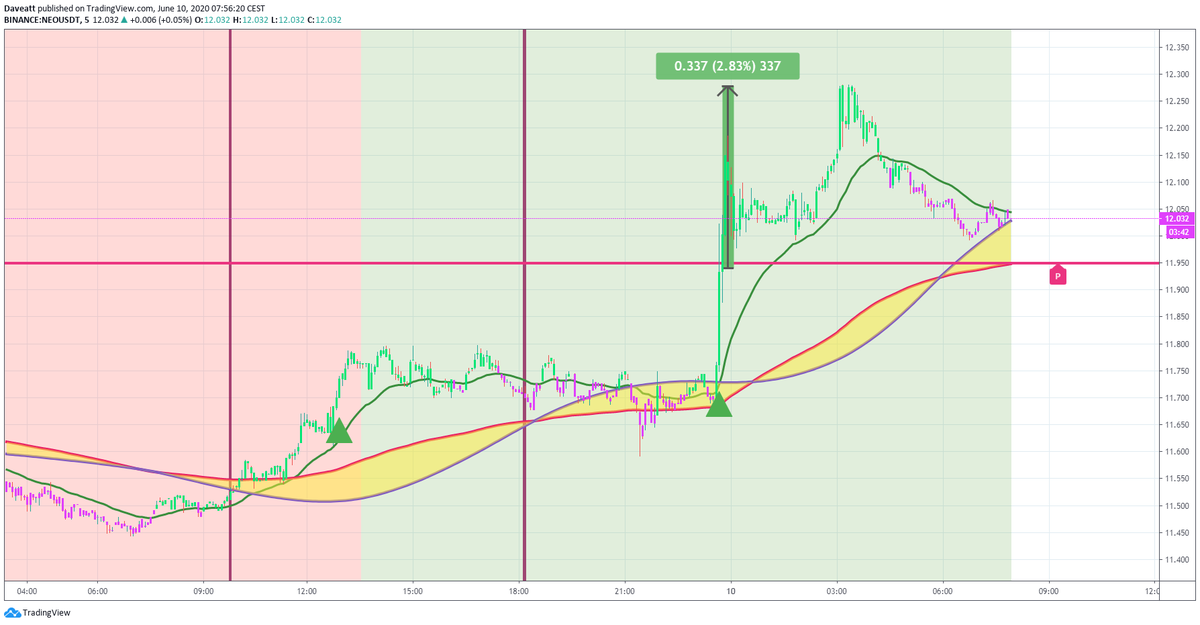
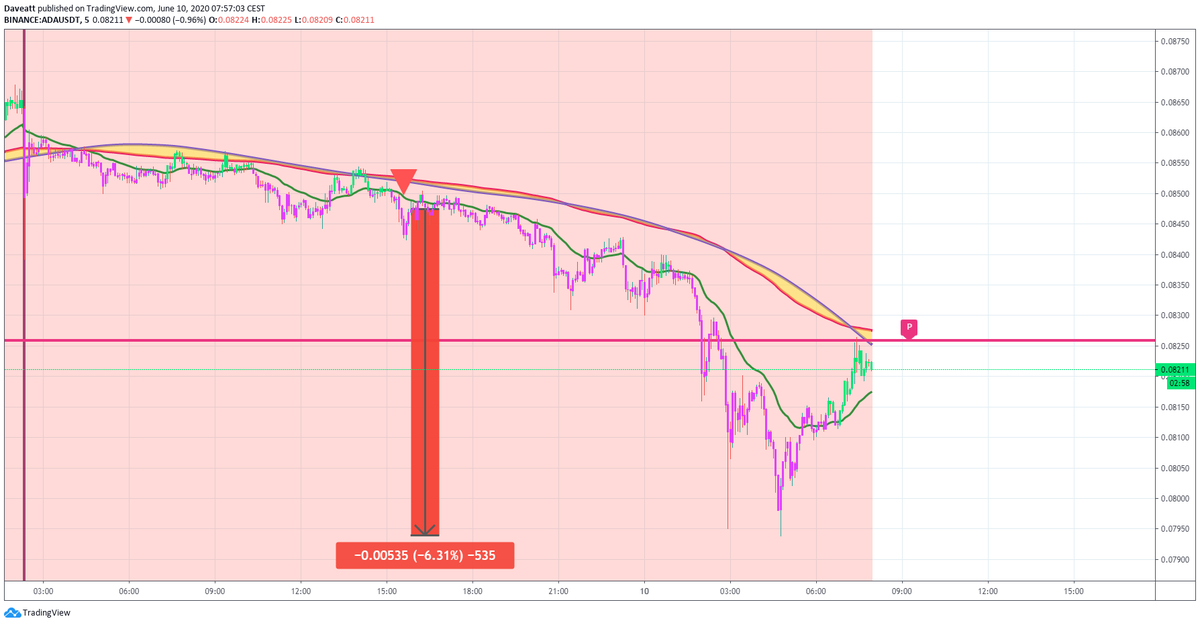
CRO NEO ADA
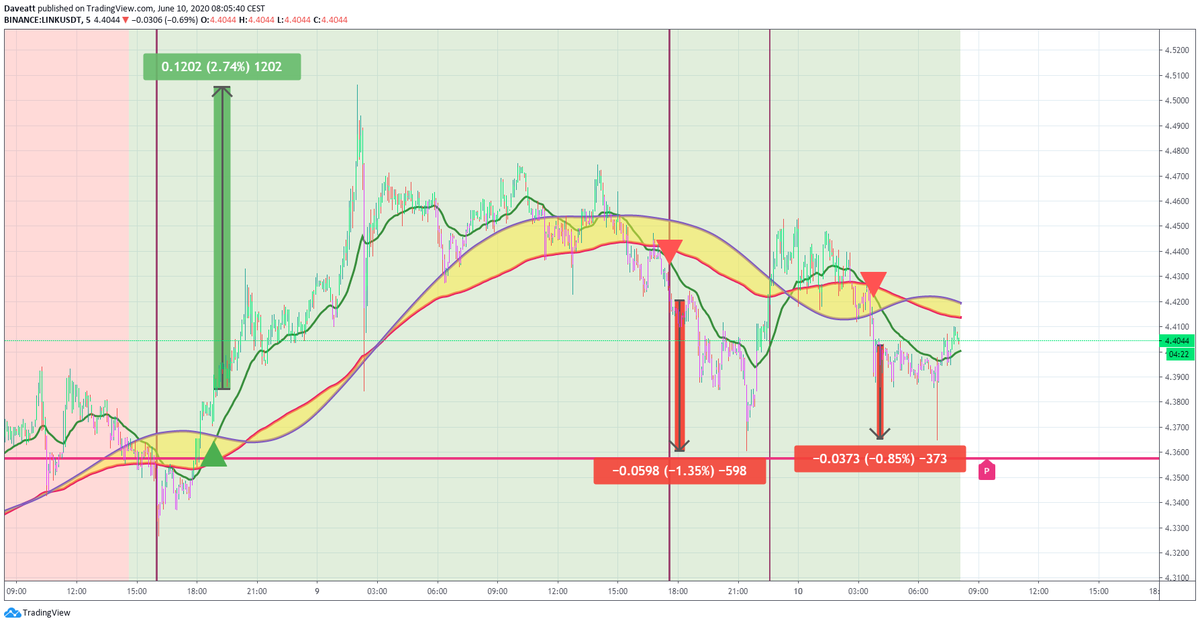
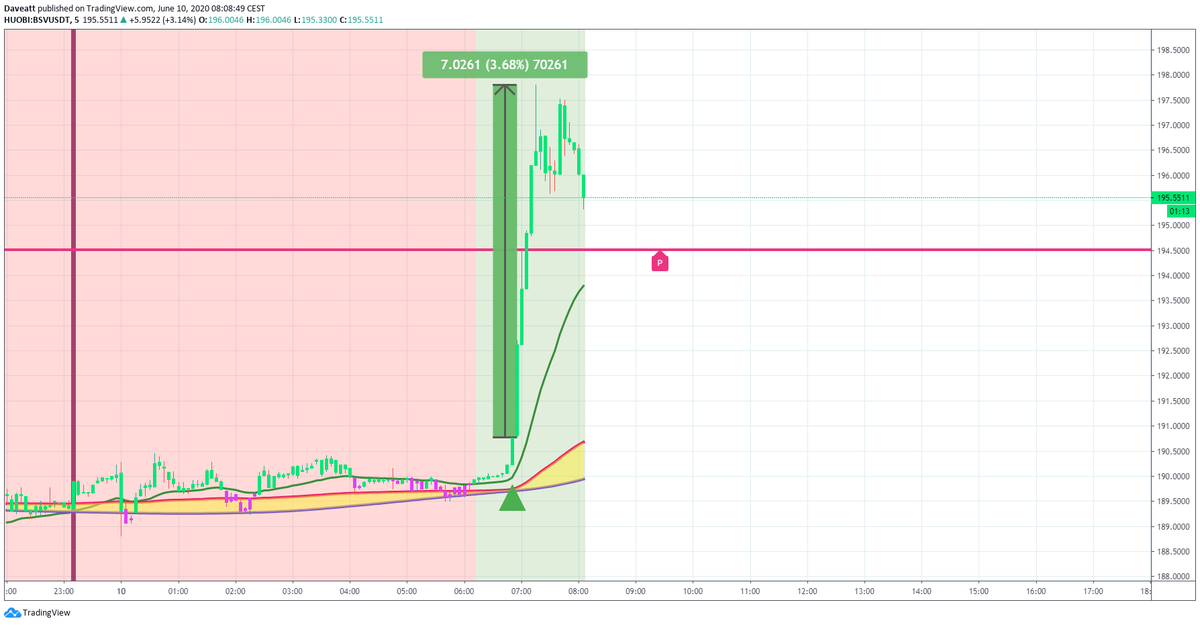
MKR LINK BSV

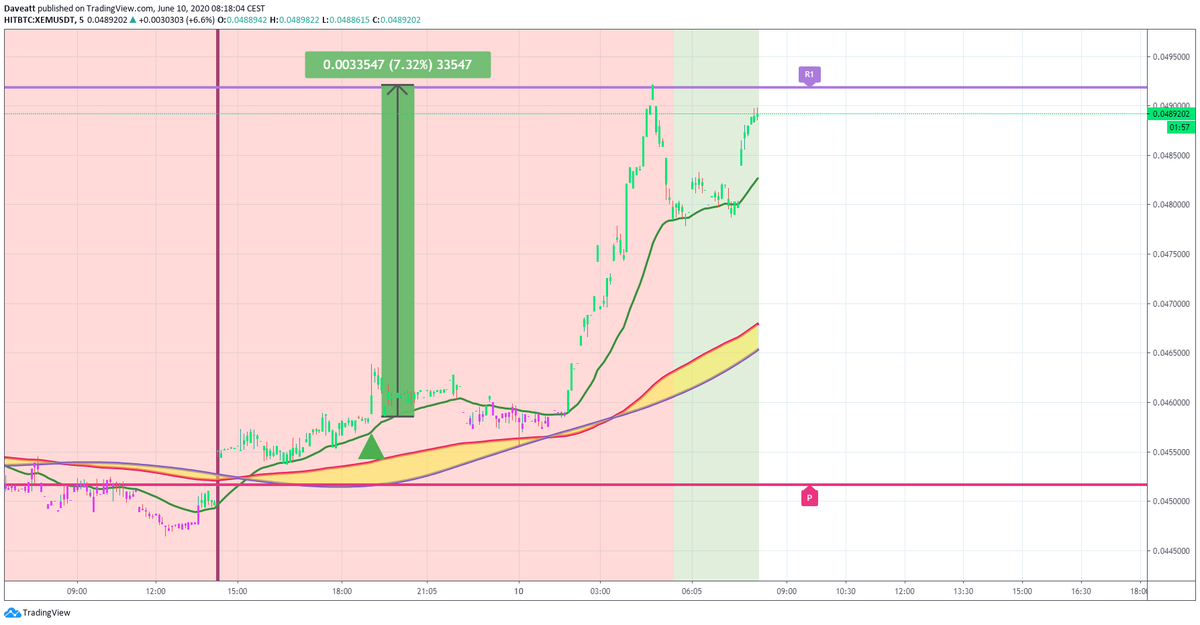
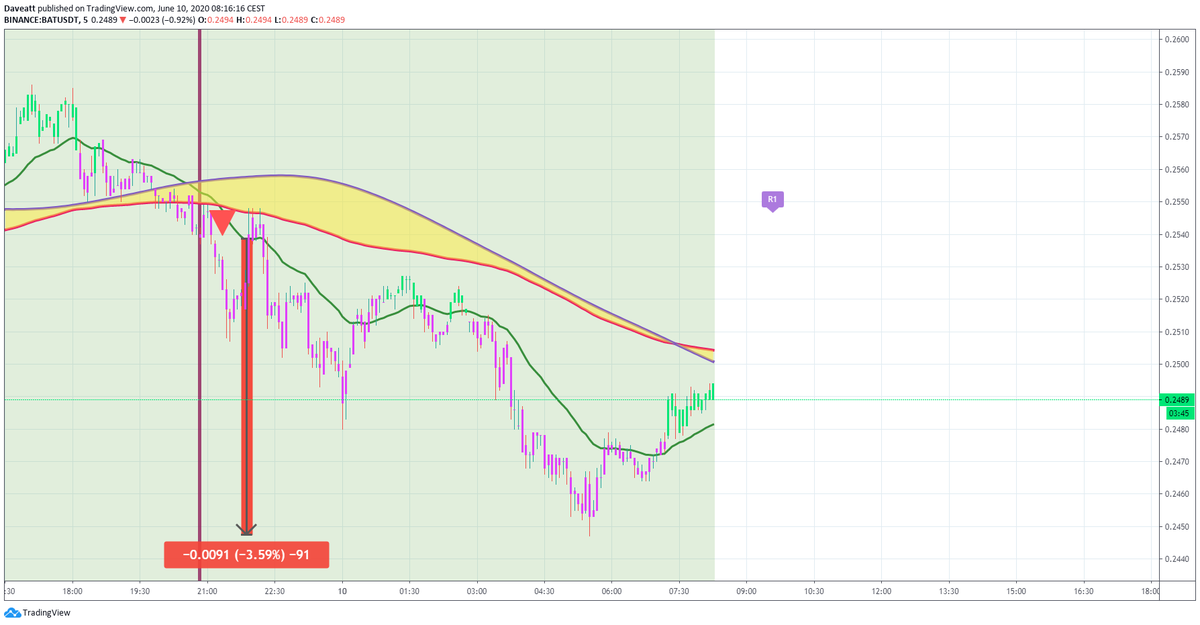
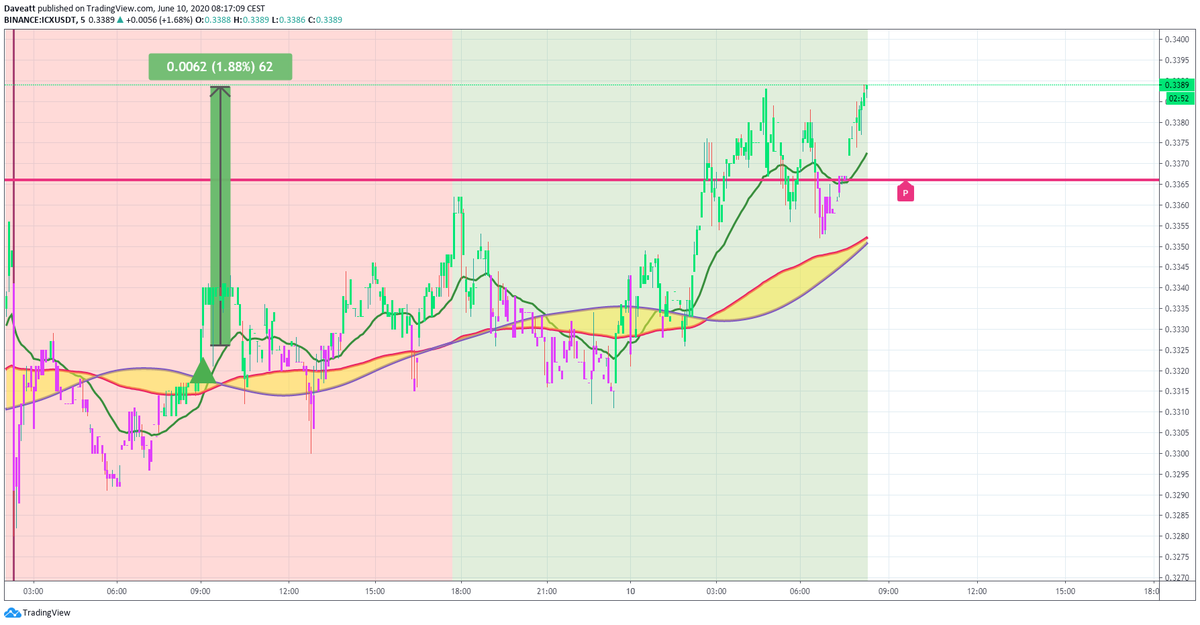
XEM BAT ICX
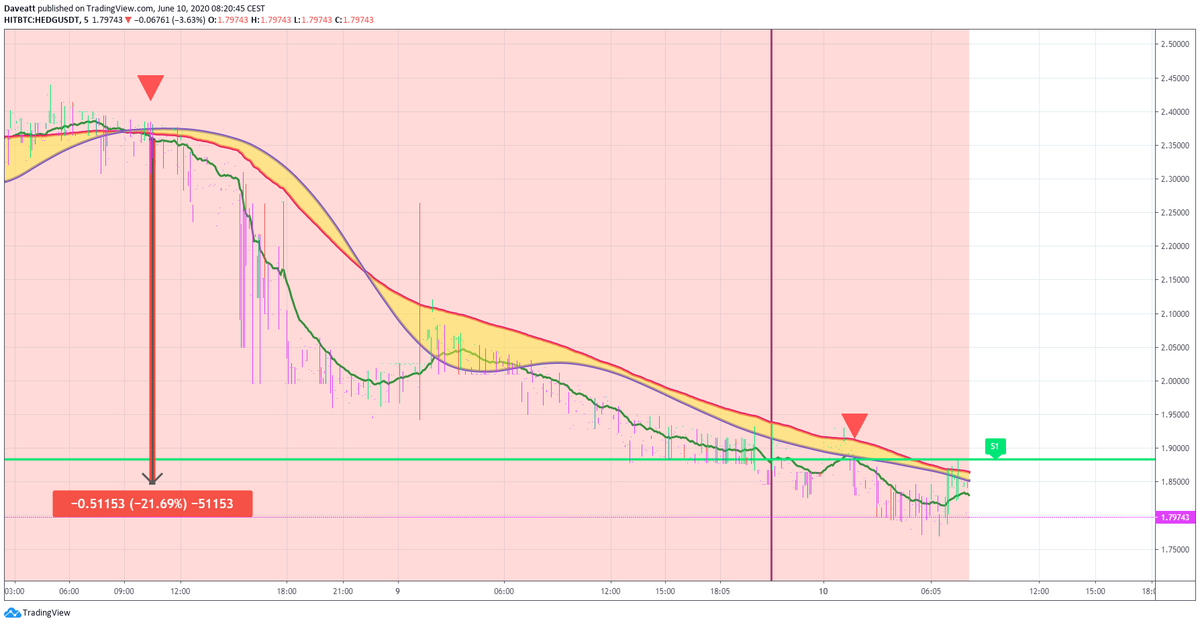
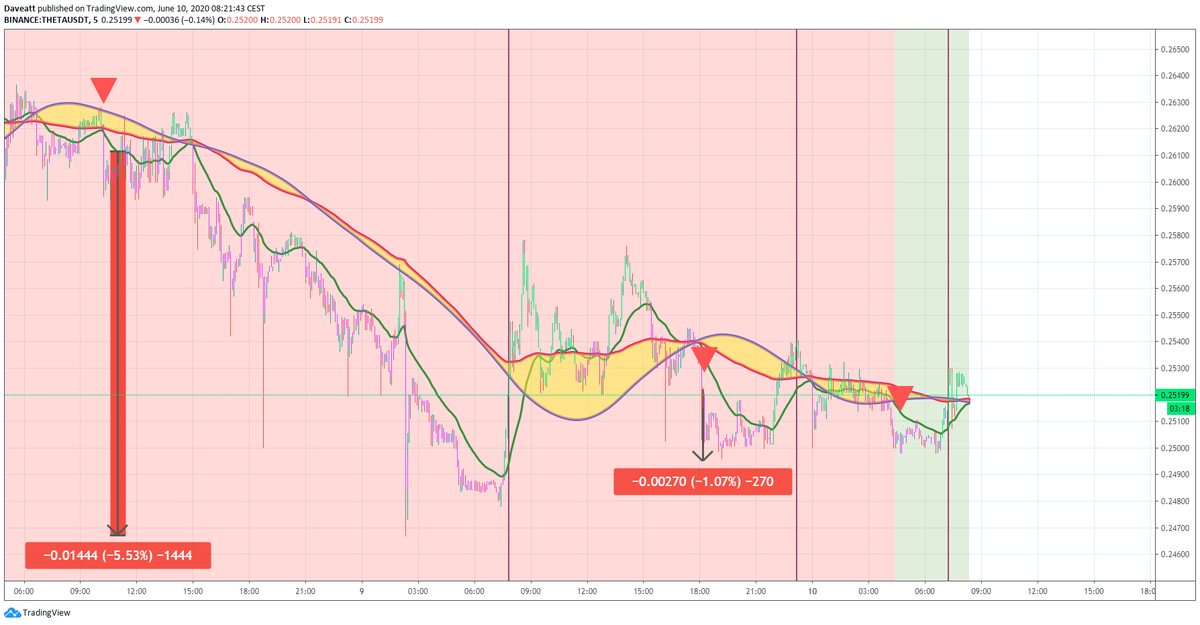
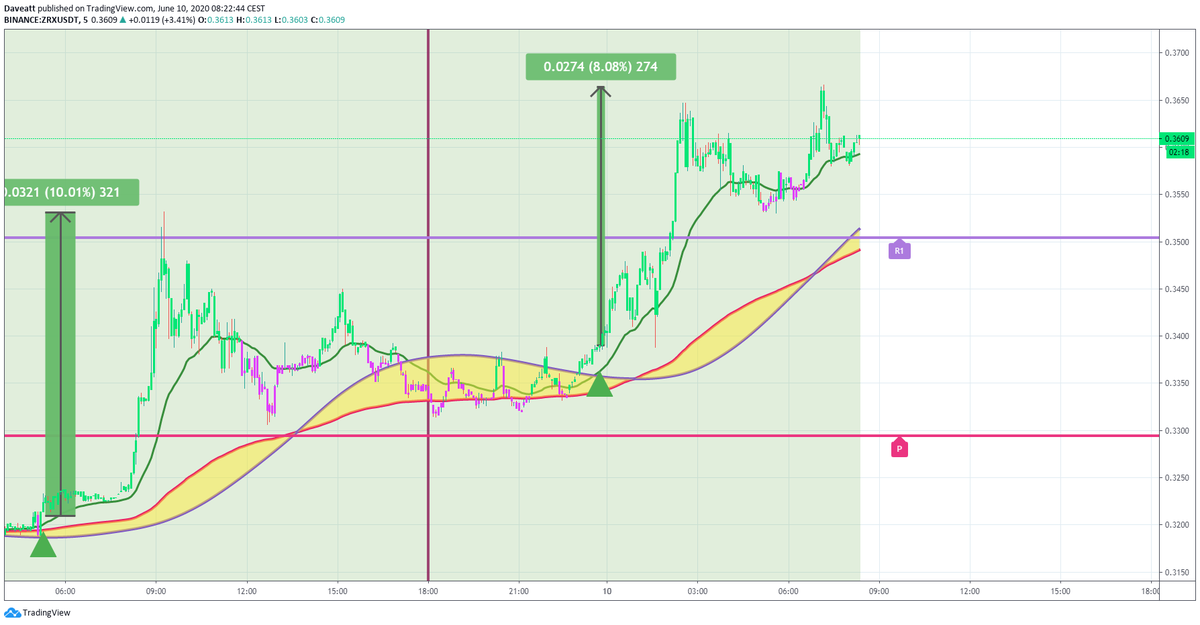
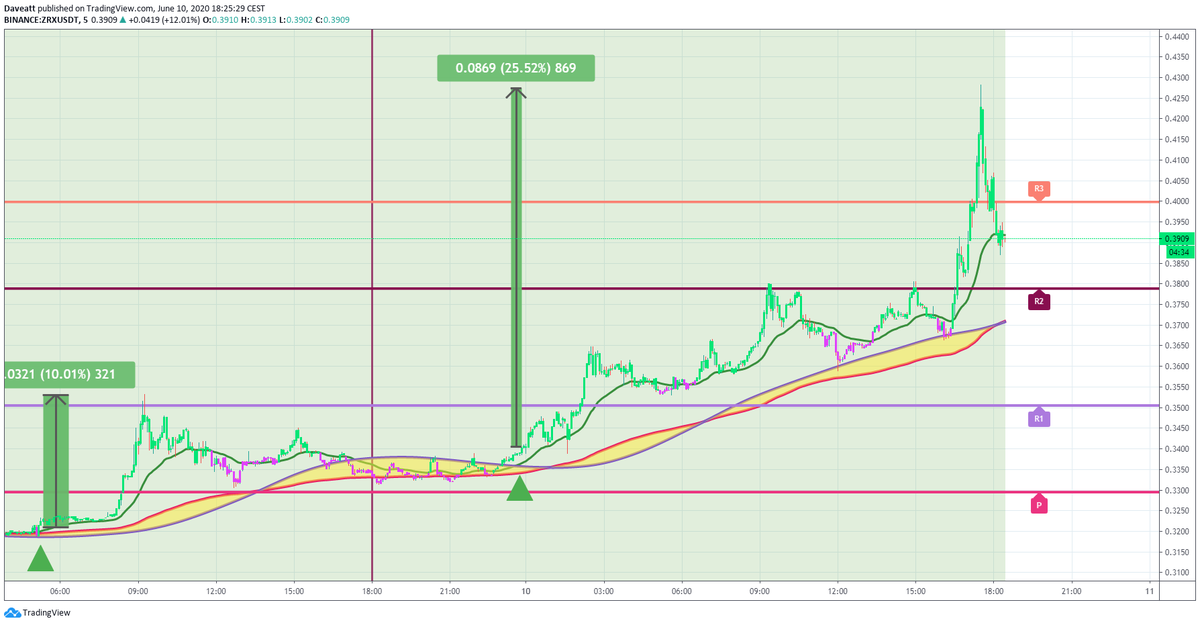
HEDG THETA ZRX
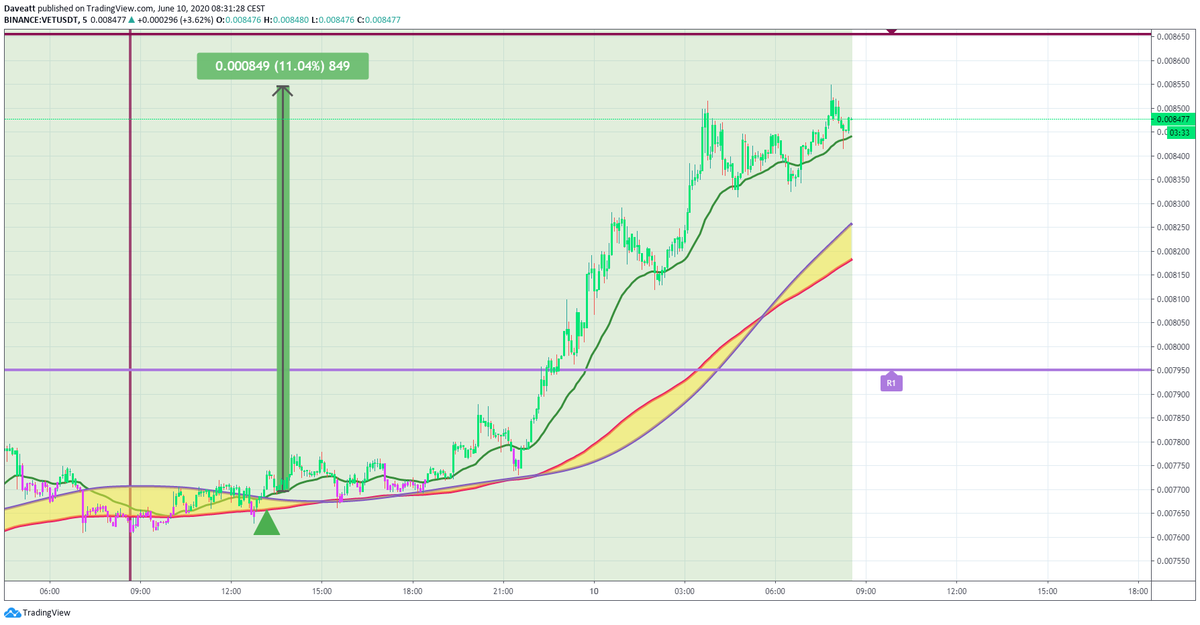
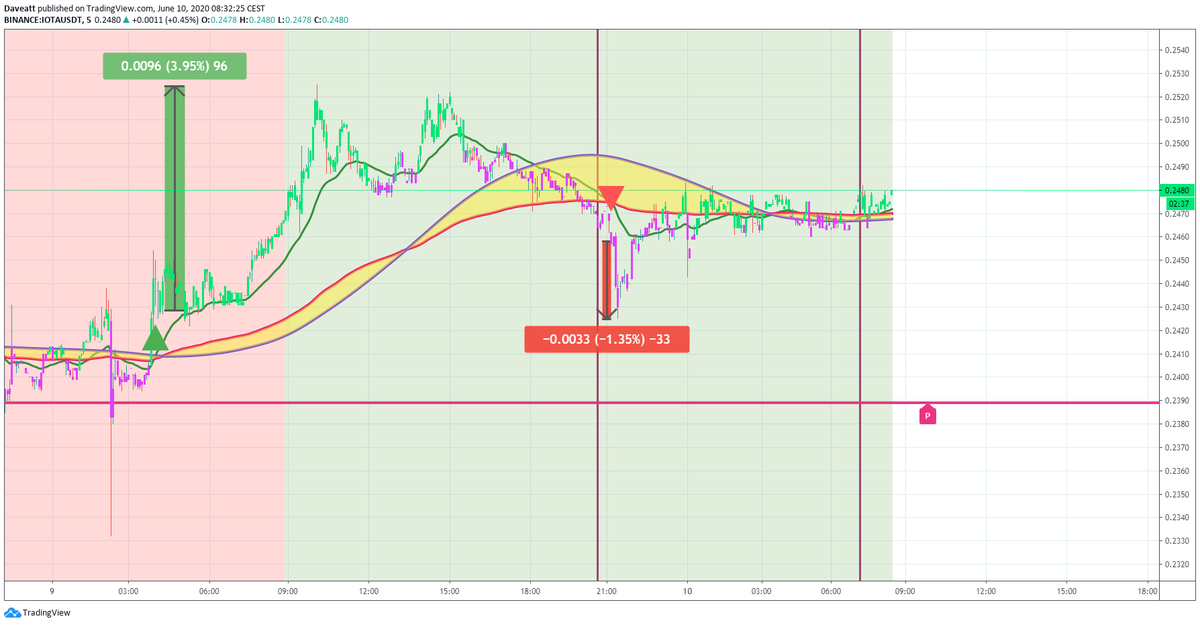
VET IOTA ATOM

Discord Signals
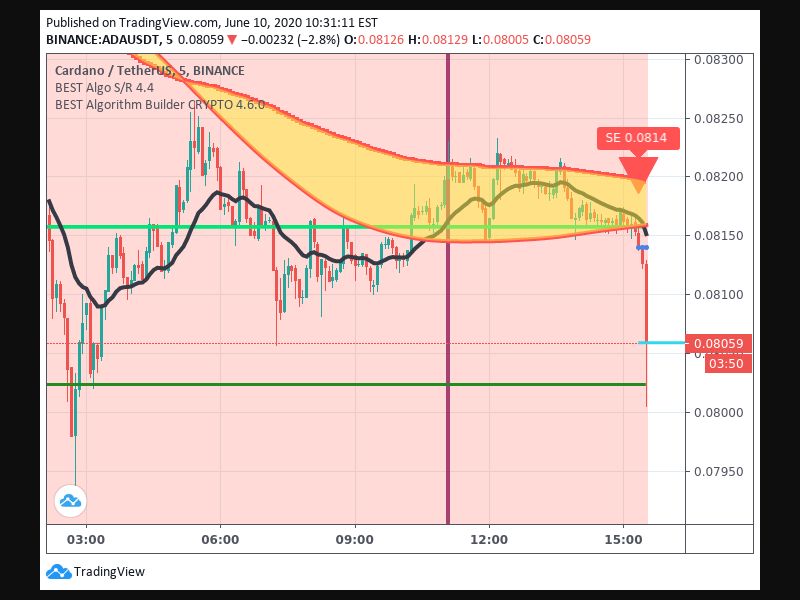
BINANCE:ADAUSDT
Asset: Cardano Direction: Short Timeframe: 5 minutes
Take Profit 1 price: 0.08059
Percentage move: 1.11%
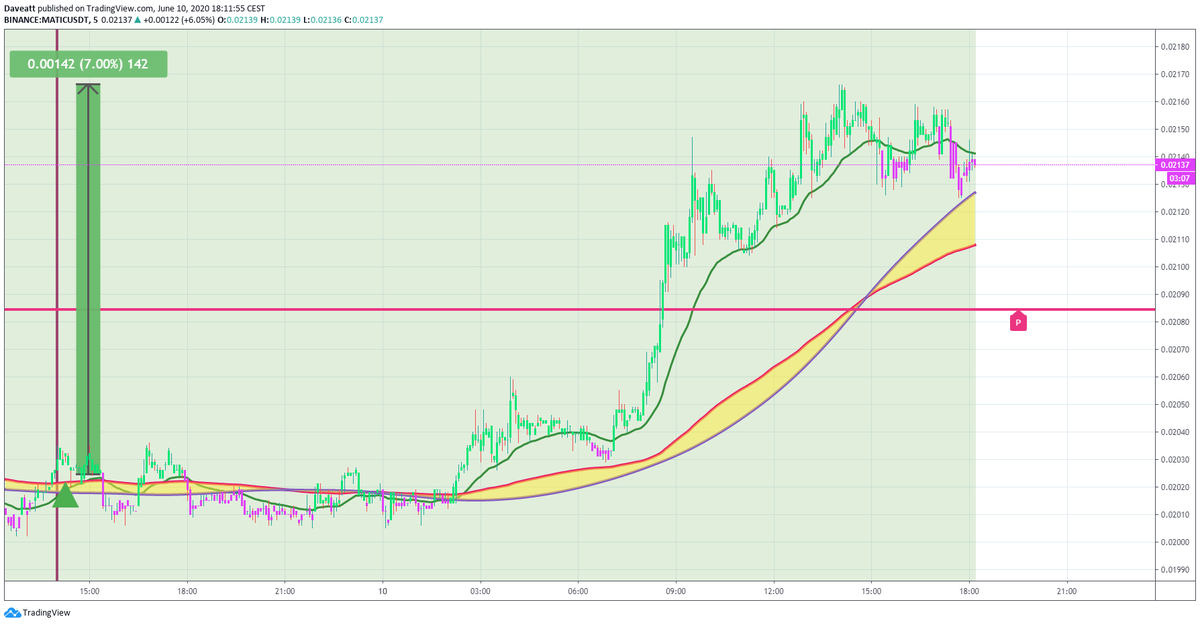
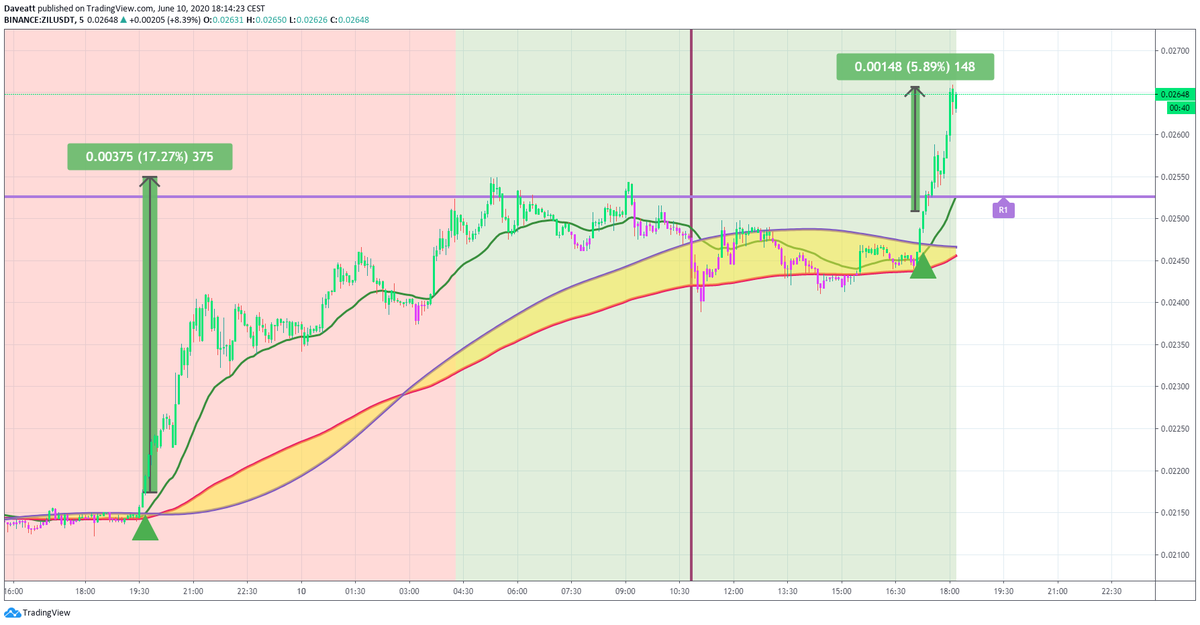
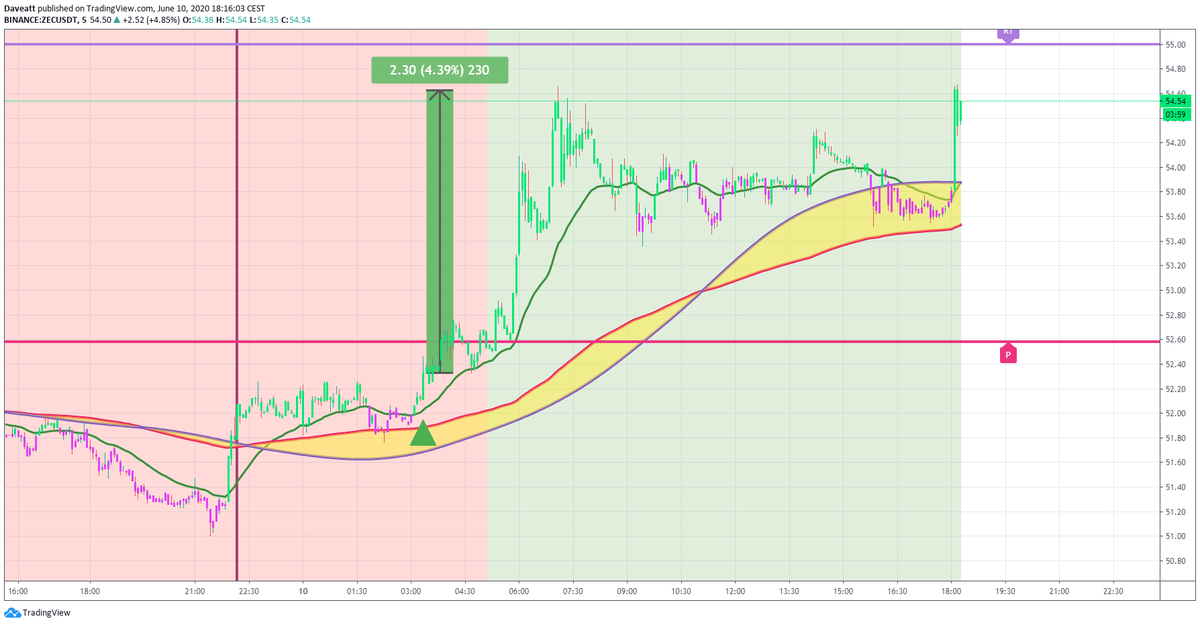
MATIC ZIL ZEC
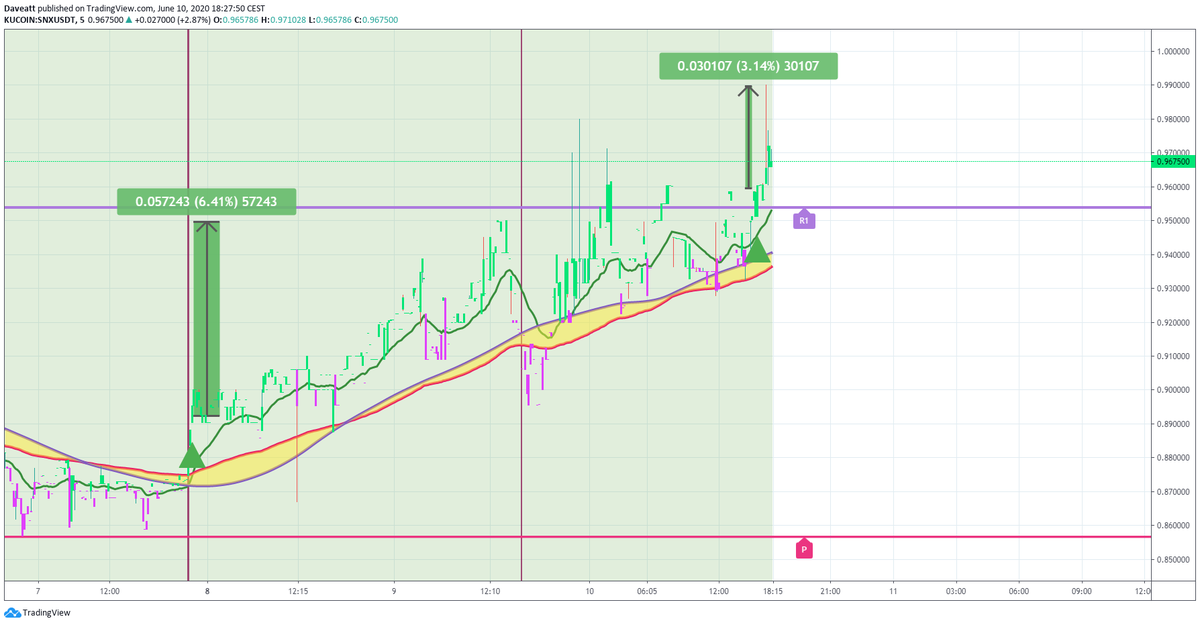
ZRX KNC SNX

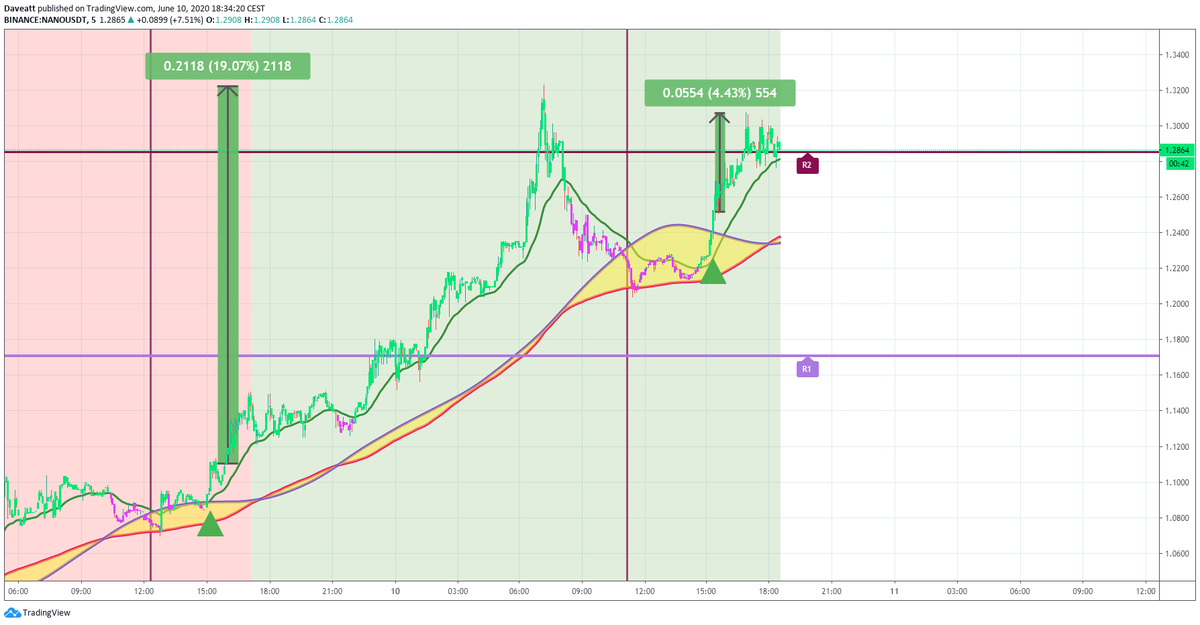
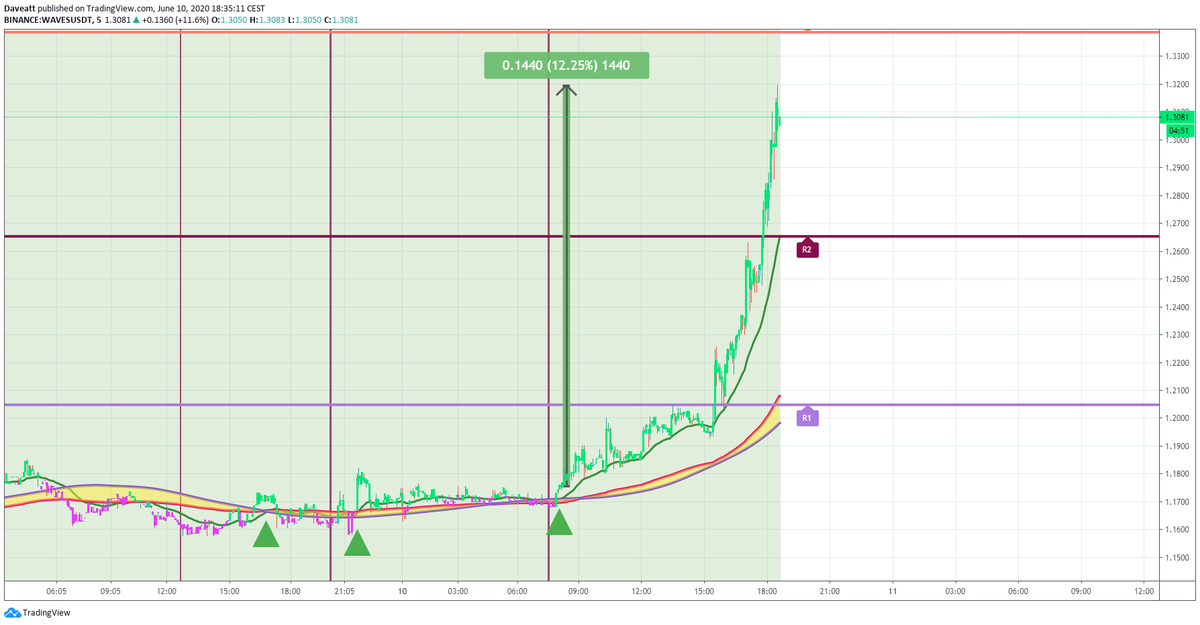
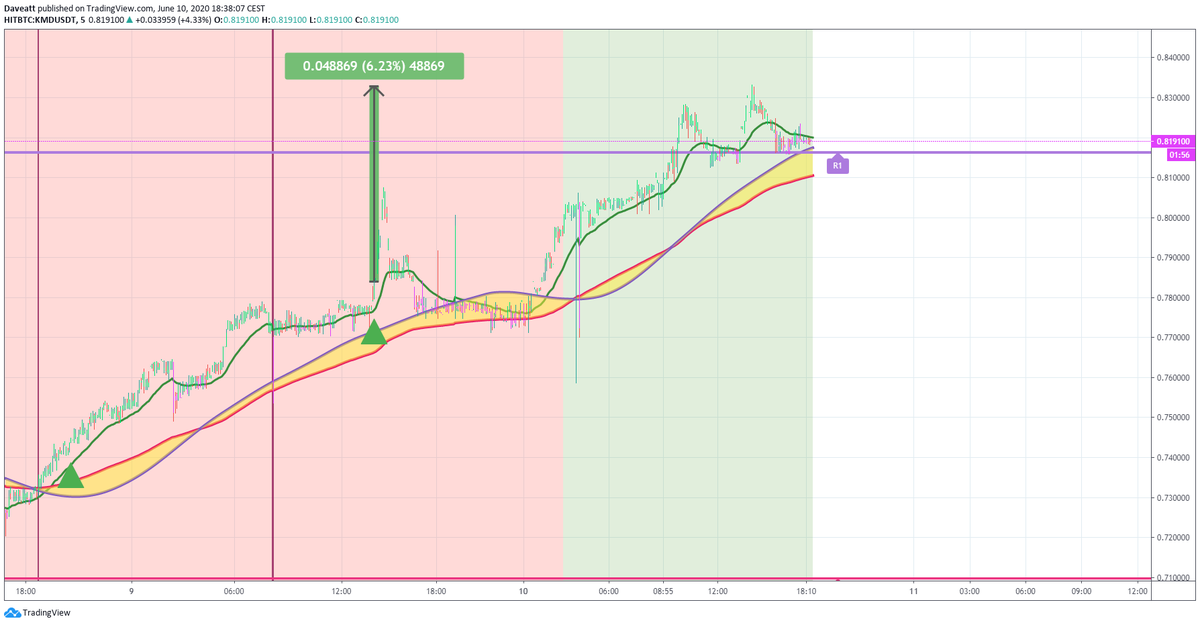
NANO WAVES KMD