Pricing plans and indicator
Why the SMA50 matter?
The SMA 50 Daily, Weekly, Monthly are three tremendous indicators for gauging a trend.
Candles above mean we're bullish, below we're bearish.
For example, if above the SMA 50 Daily and below the SMA 50 Weekly.
We're bullish on a Daily timeframe but bearish on a Weekly timeframe.
Once above the Weekly SMA 50, the upwards momentum may accelerate.
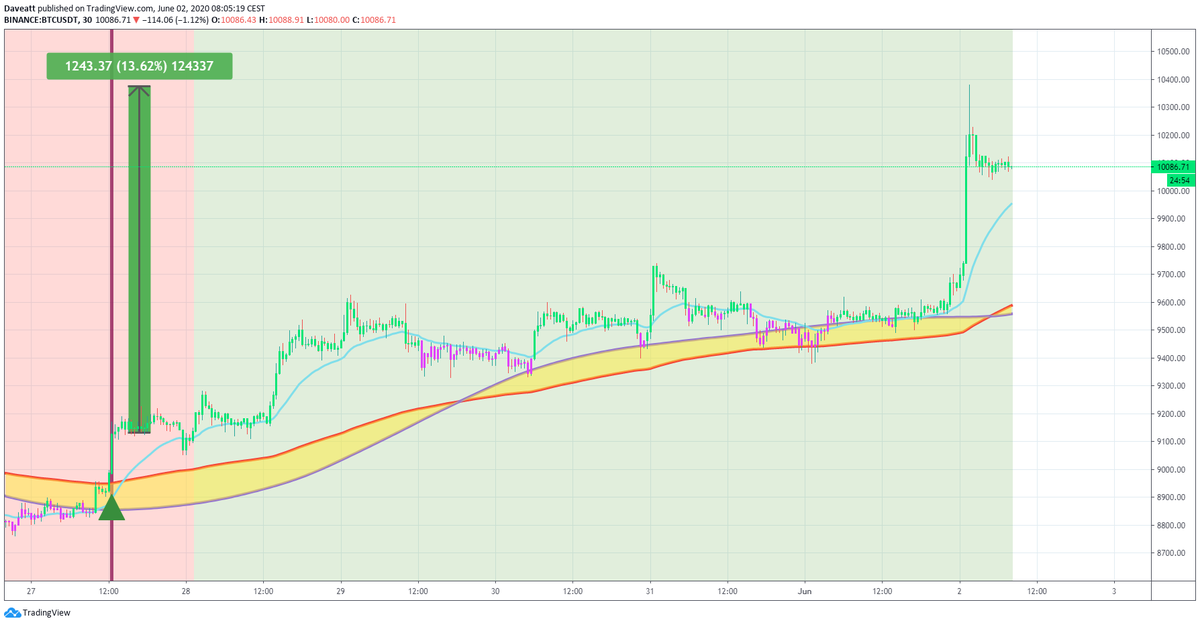
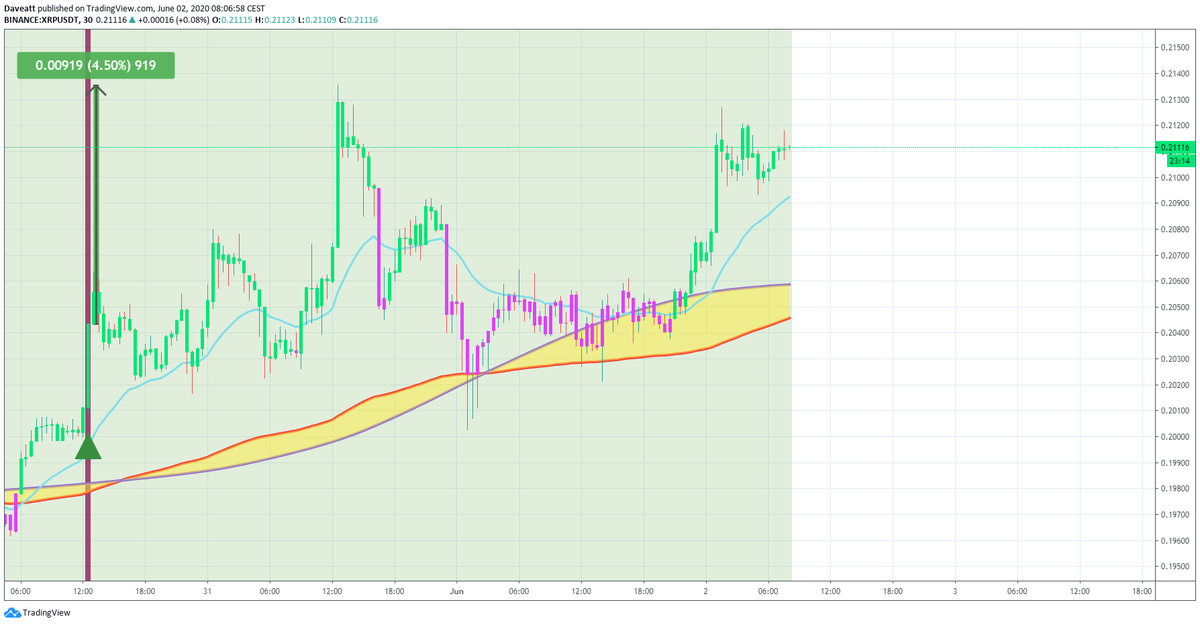
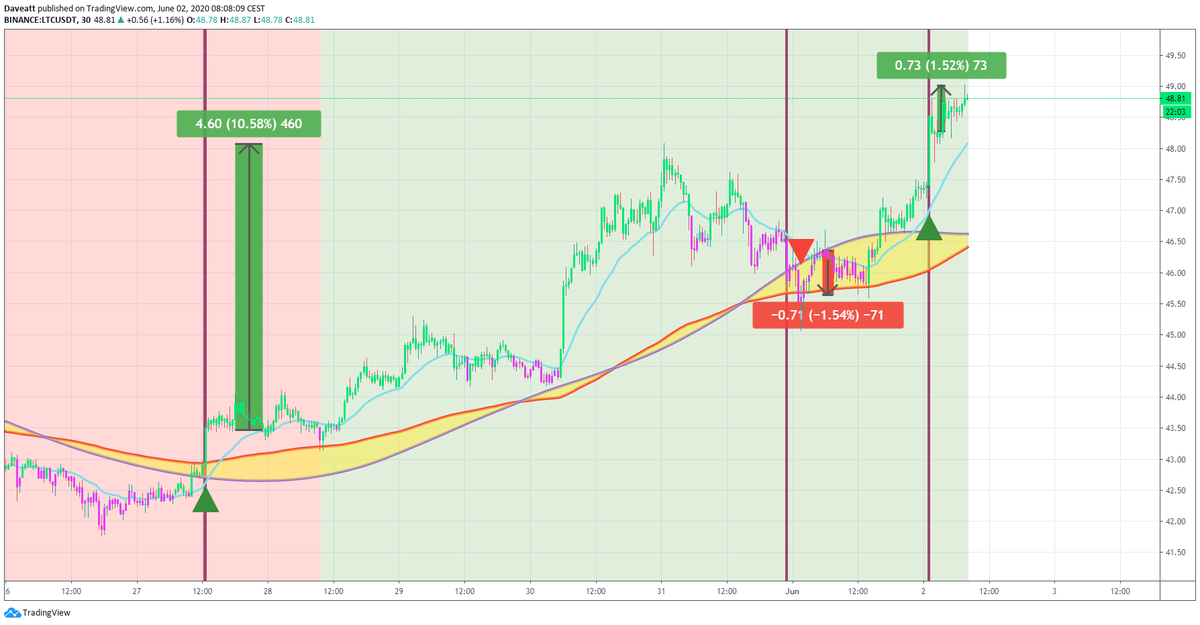
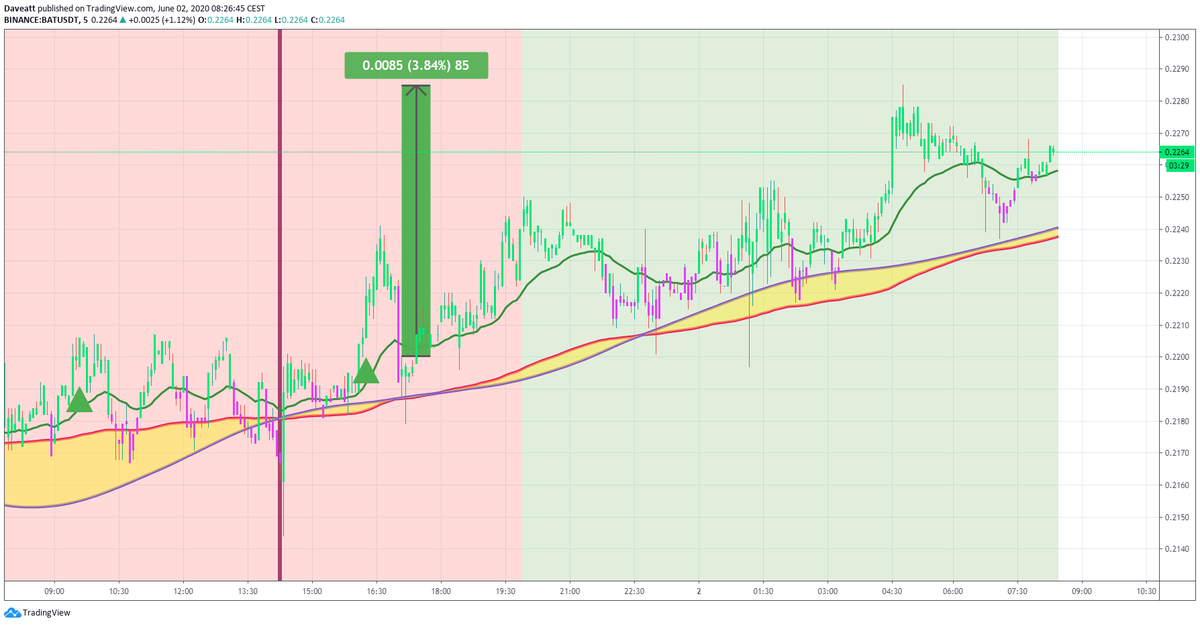
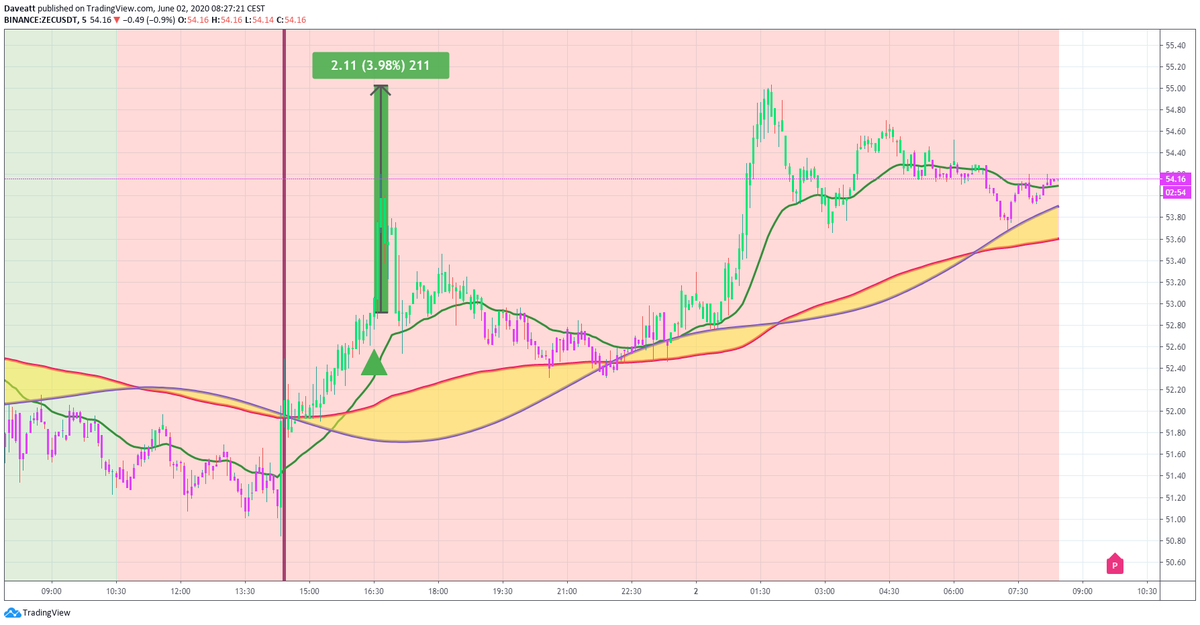
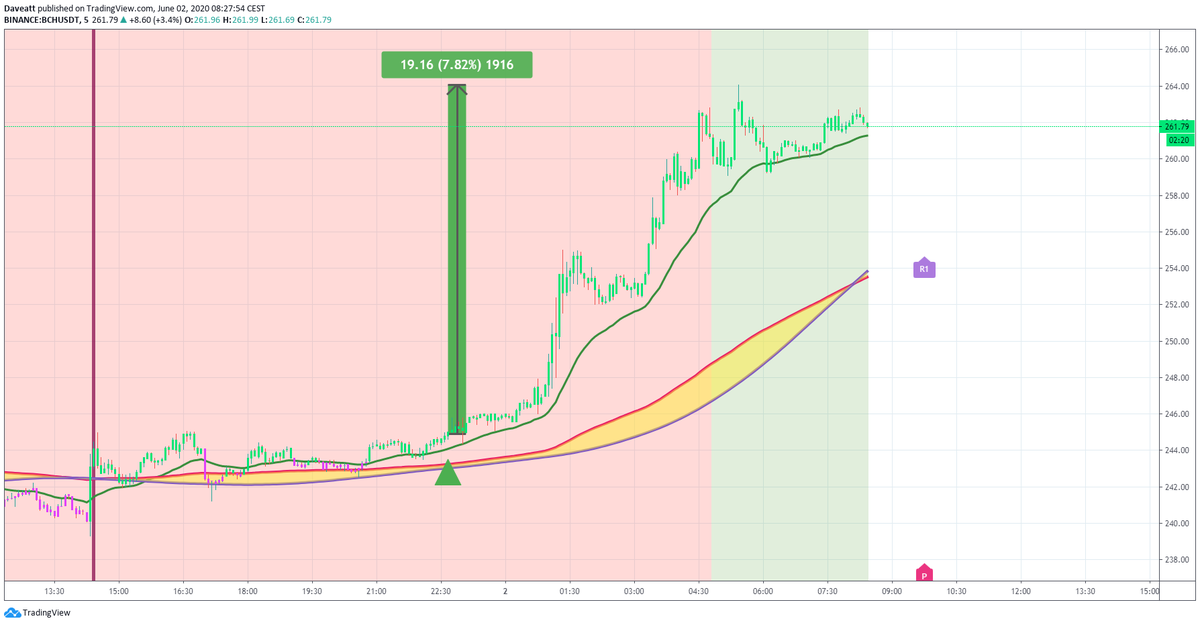
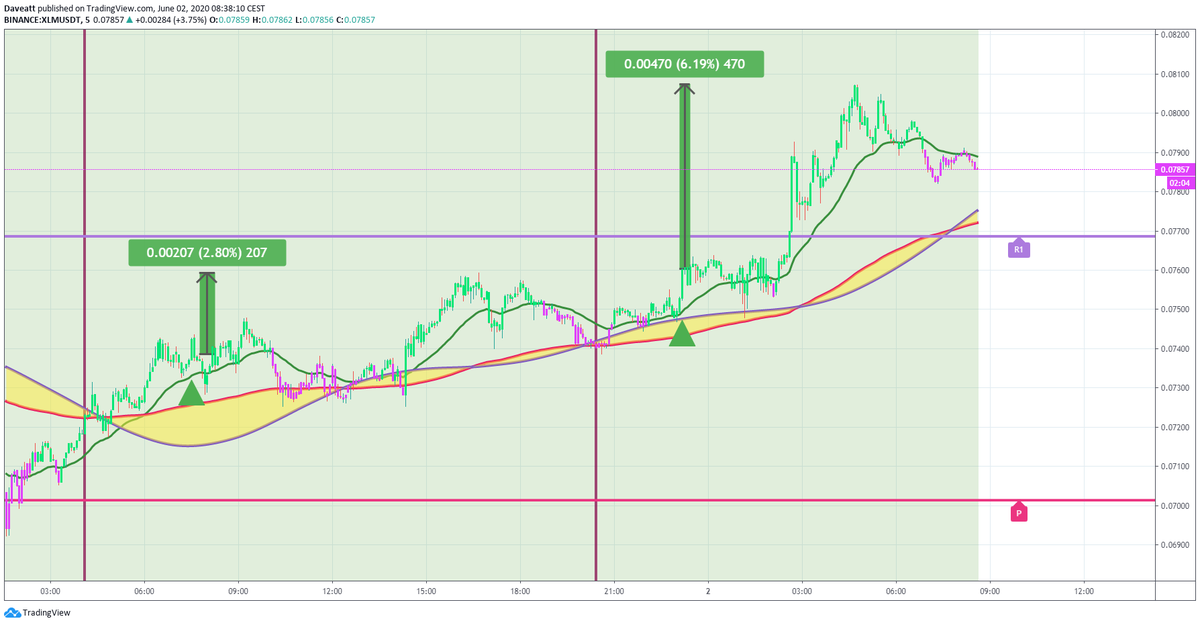
We're trading cryptocurrencies with the Algo Builder Crypto Intraday 5-minutes and Algo Builder Universal 15-minutes
A quite note
Each screenshot below is clickable and can be enlarged for better visibility
Discord shared signals and results
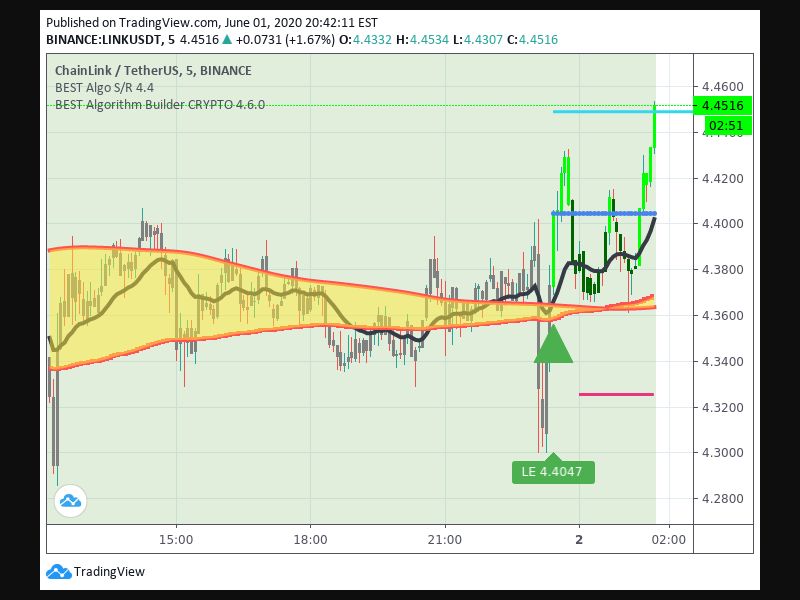
BINANCE LINKUSDT
Asset: Chainlink Direction: Long
Timeframe: 5 min
Take Profit 1
Price: 4.4487000000000005
Percentage move: 1%
Discord Signals
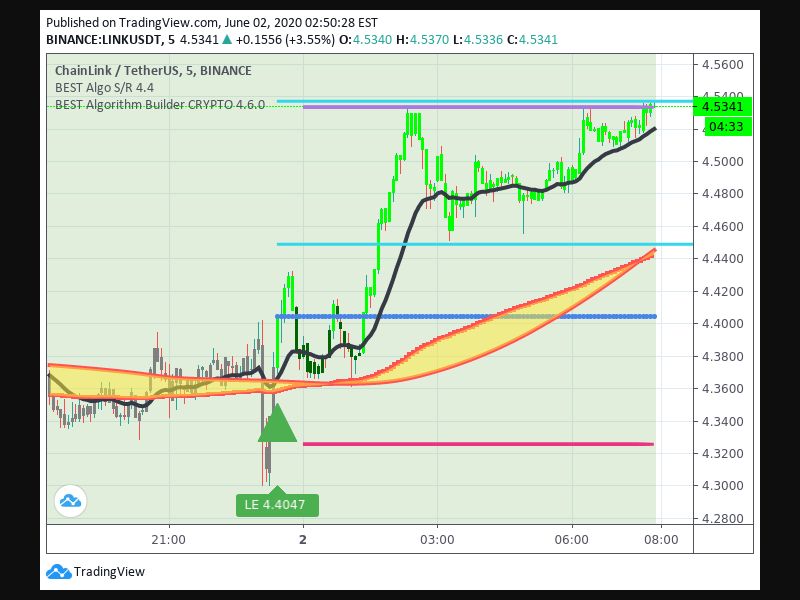
BINANCE:LINKUSDT
Asset: Chainlink Direction: Long
Timeframe: 5
Take Profit 2 Price :4.5368 Pips
Percentage move: 3%
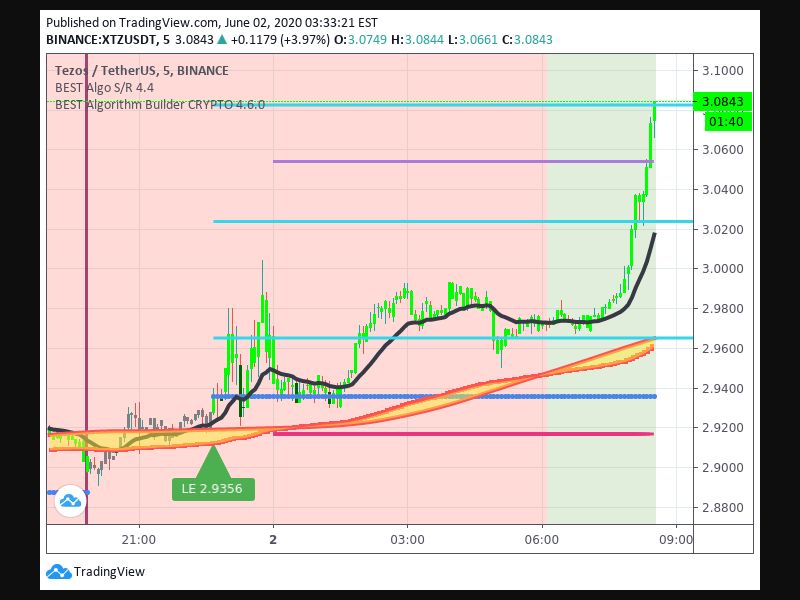
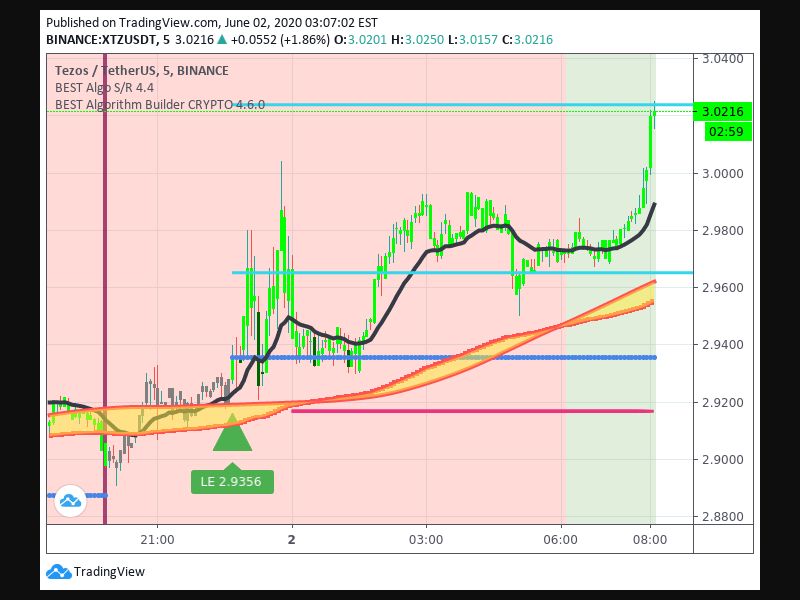
BINANCE:XTZUSDT
Asset: Tezos Direction: Long
Timeframe: 5 min Take Profit 2 price :3.0237000000000003
Percentage move: 3%
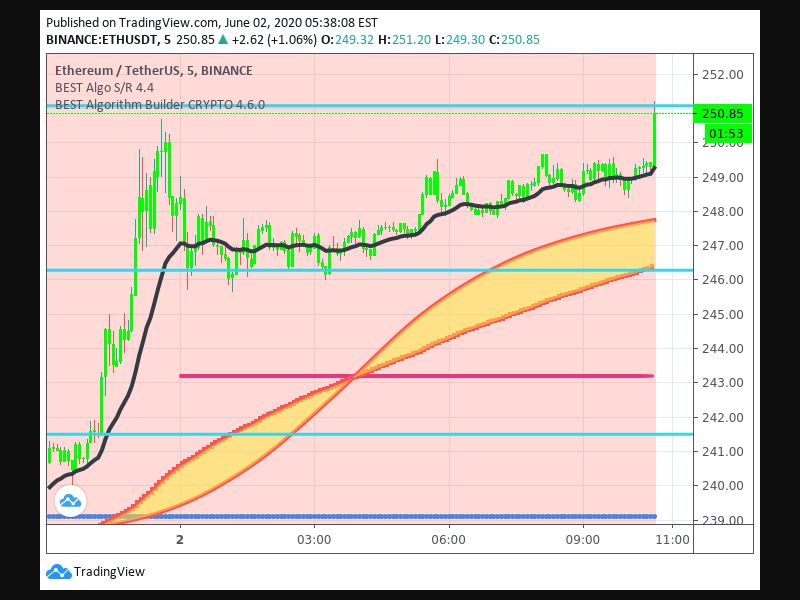
BINANCE:ETHUSDT
Asset: Ethereum Direction: Long
Timeframe: 5 min
Take Profit 3 price: 251.06
Pips gained:12 USDT
Percentage move:5.02%
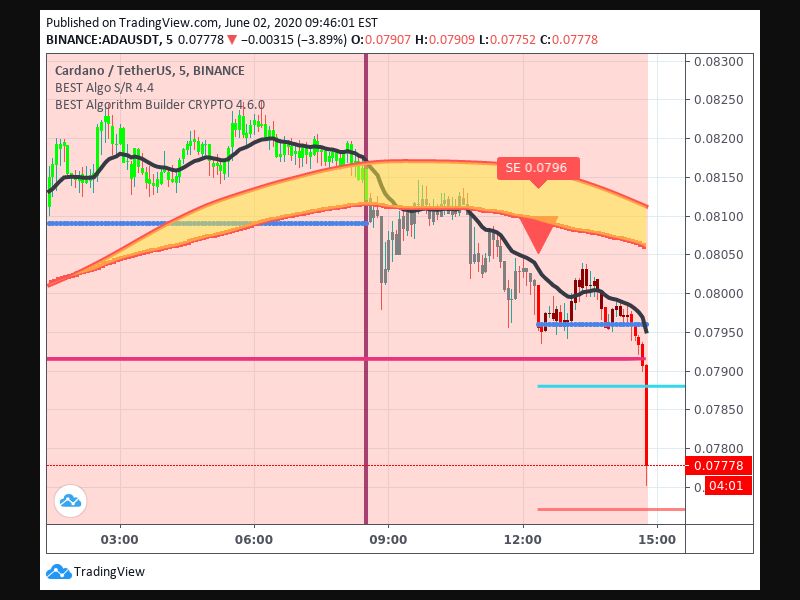
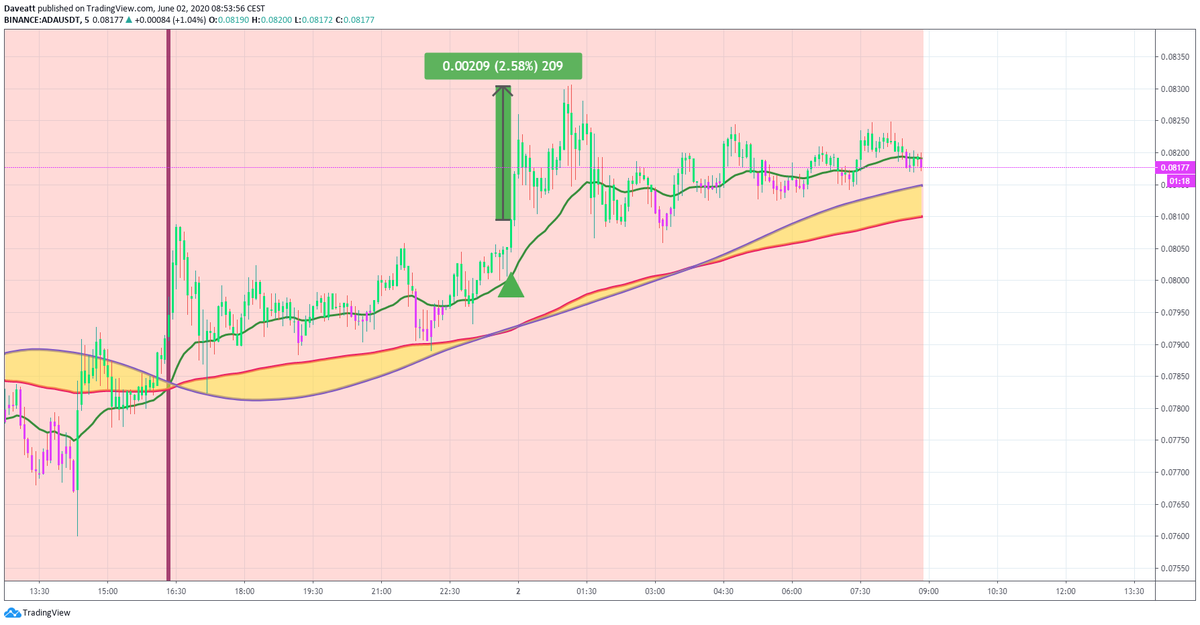
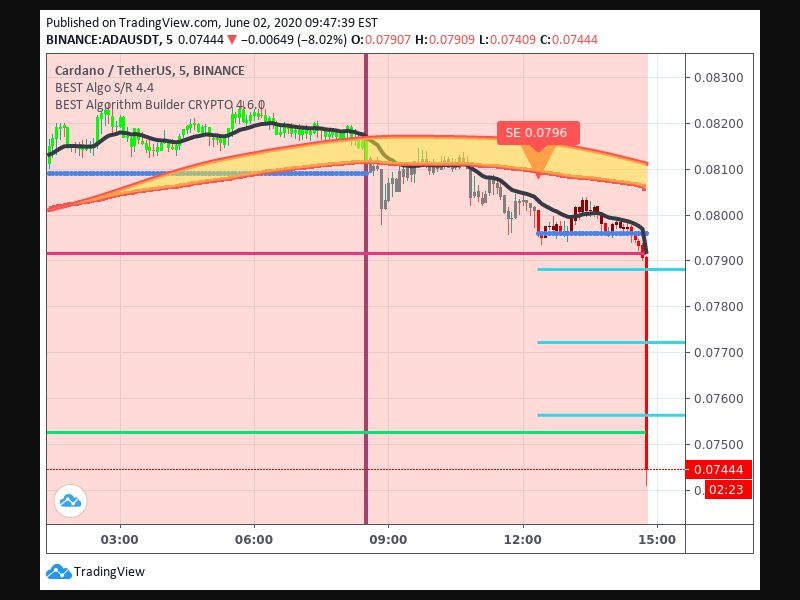
BINANCE:ADAUSDT
Asset: Cardano
Direction: Short
Timeframe: 5
Take Profit 1 price: 0.0788
Percentage move: 1.01%
