Pricing plans and indicator
The Heikin Ashi
Heikin Ashi (HA) candles have a Japanese name but they have nothing to do with the traditional Japanese candlesticks we see everywhere.
Like many others, Heiken Ashi is a charting technique. Or, an indicator.
It changes the current, regular candles, with new ones. The Heiken Ashi price bars are averaged using a specific formula.
As such, the high, low, closing, and opening prices won’t be the same. Here’s the formula Heiken Ashi indicator uses to calculate the four prices mentioned earlier:
Close = (Open + High + Low + Close)/4
High = Maximum value between High, Open or Close
Low = Minimum values between Low, Open or Close
Open = (Previous candle open + Previous candle close)/2
The idea of a Heiken Ashi chart is that it filters the noise. Because the Heiken Ashi candlesticks are the result of averaging prices, the candles will have smaller shadows than a regular candlestick chart.
We're trading crypto with the Algo Builder Crypto Intraday 5-minutes and Algo Builder Universal 15-minutes
A quite note
Each screenshot below is clickable and can be enlarged for better visibility
Discord Public Trades
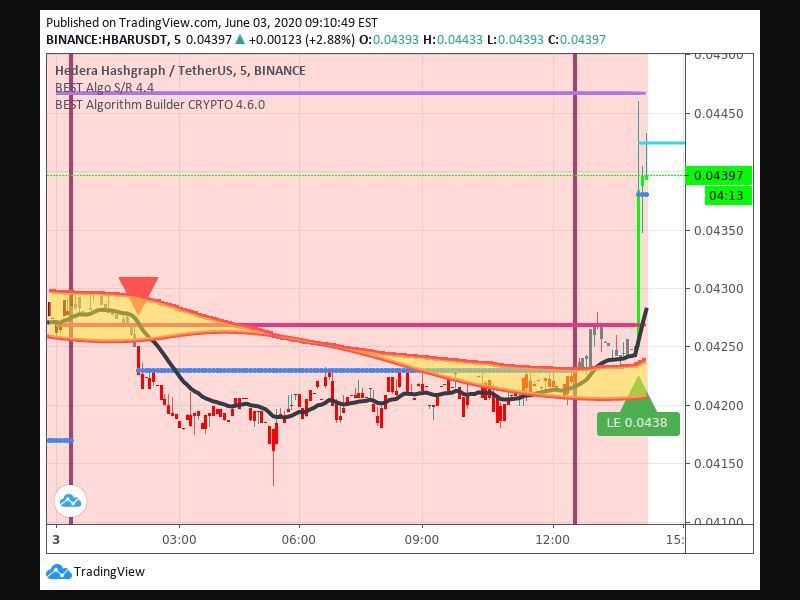
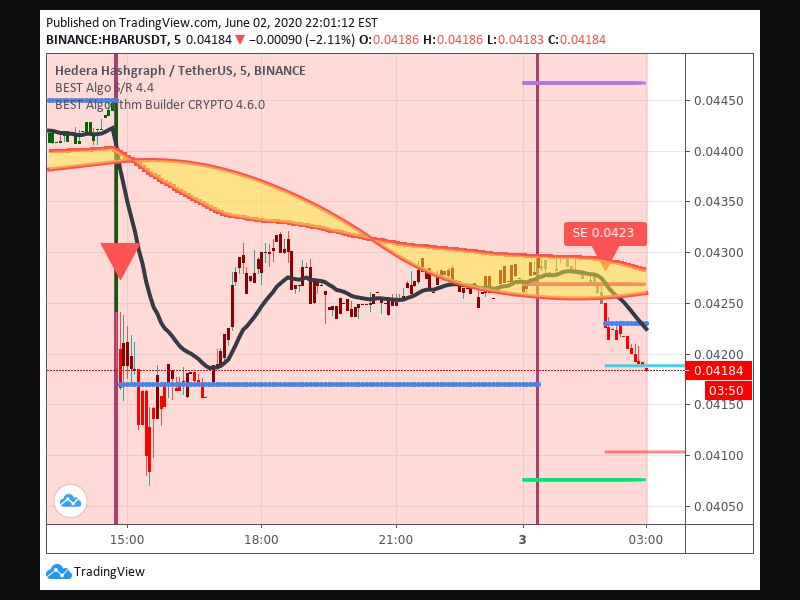
BINANCE:HBARUSDT
Asset: Hedera Hashgraph Direction: Short
Timeframe: 5 minutes
Take Profit 1 price :0.04188
Percentage move: 1.18%
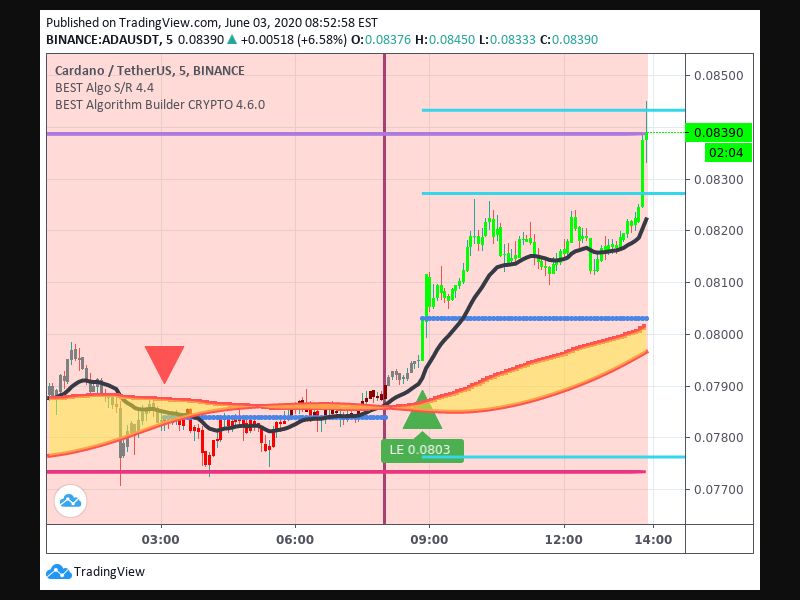
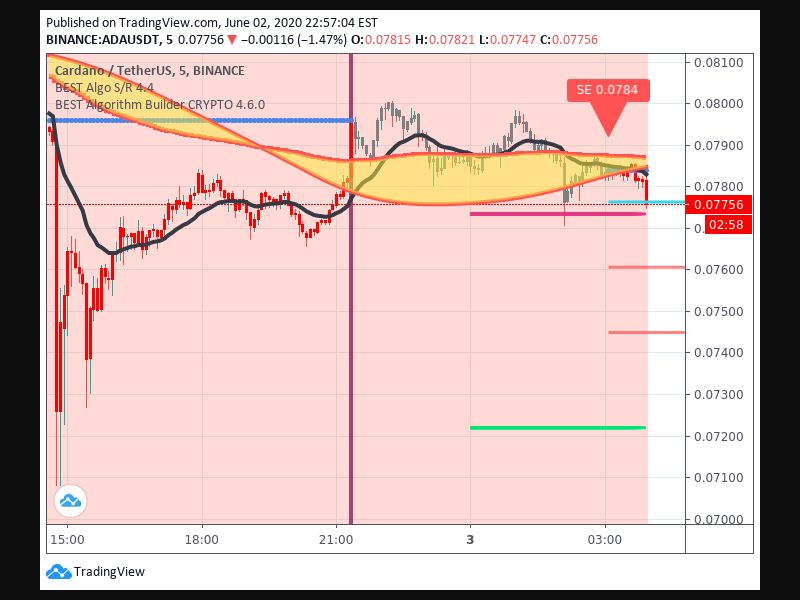
BINANCE:ADAUSDT
Asset: Cardano Direction: Short
Timeframe: 5 minutes
Take Profit 1 price: 0.07762
Percentage move: 1.02%
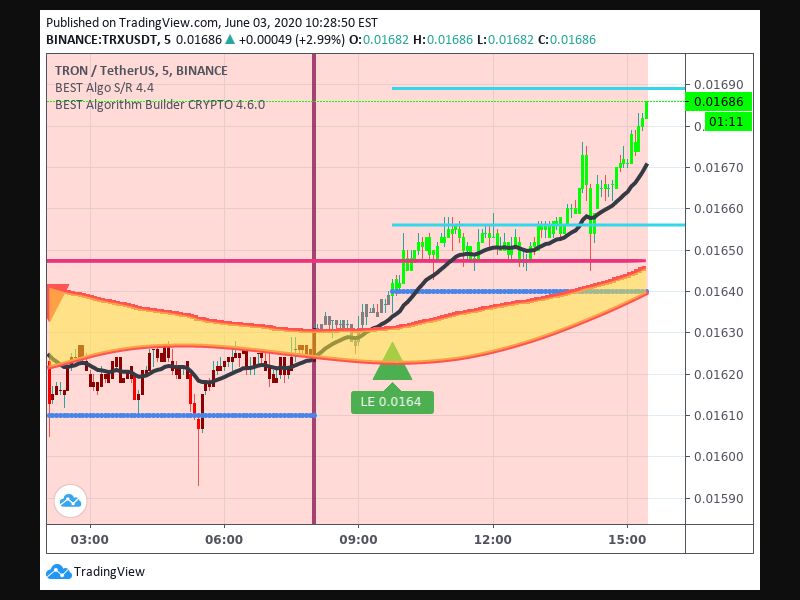
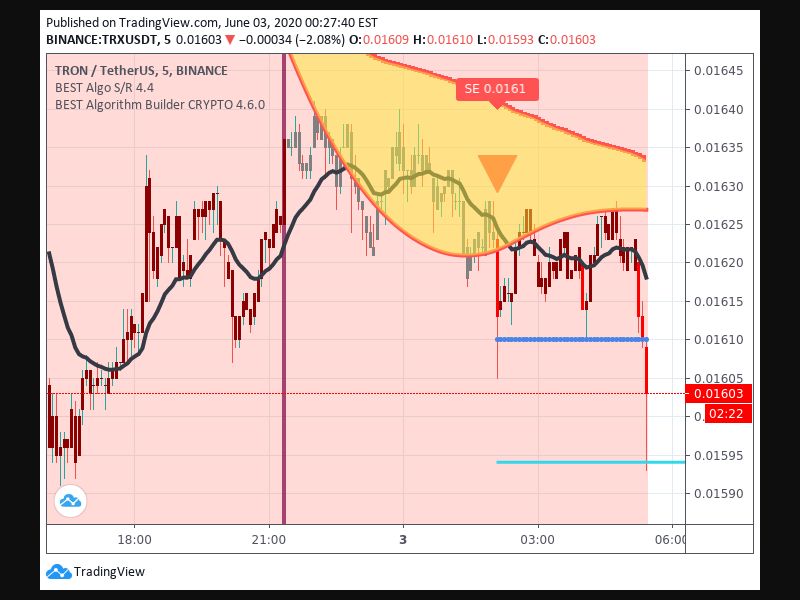
BINANCE:TRXUSDT
Asset: TRON Direction: Short
Timeframe: 5 min
Take Profit 1 price: 0.01594
Percentage move: 1.24%
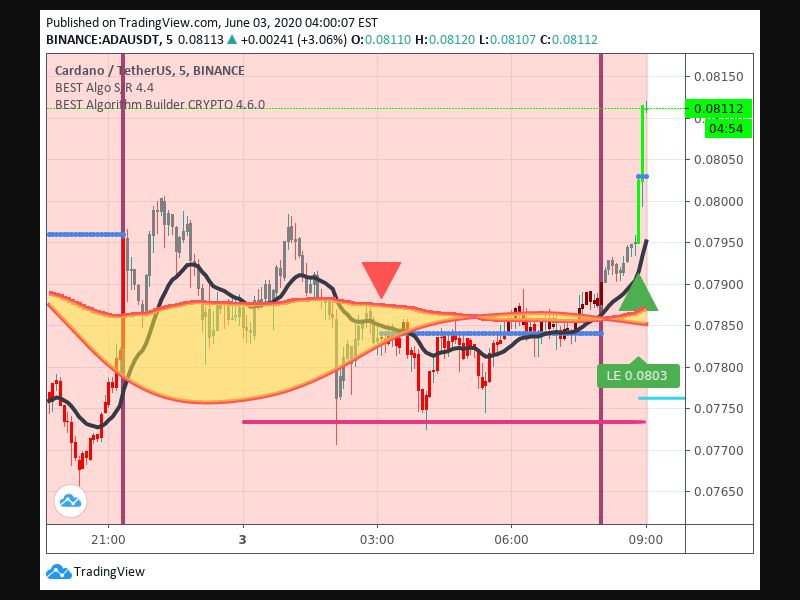
BINANCE:ADAUSDT
Asset: Cardano Direction: Long
Timeframe: 5 minutes
Take Profit 1 price: 0.07762
Percentage move: 1%
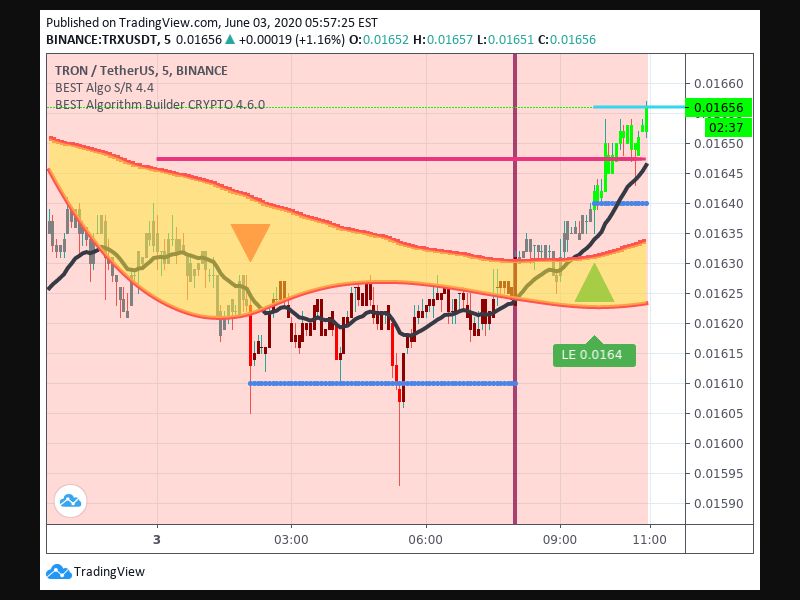
BINANCE:TRXUSDT
Asset: TRON Direction: Long
Timeframe: 5 min
Take Profit 1 price: 0.01656
Percentage move: 1.22%
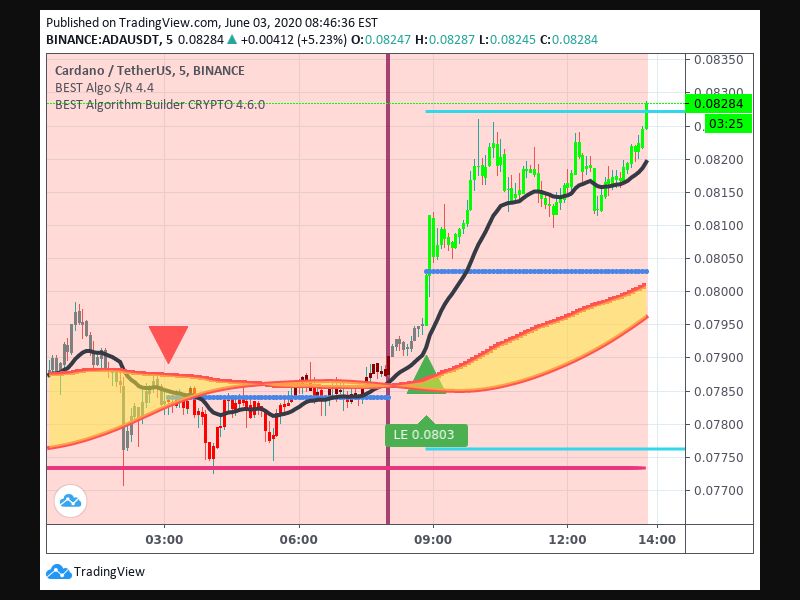
BINANCE:ADAUSDT
Asset: Cardano Direction: Long
Timeframe: 5 minutes Take Profit 2 price :0.08271
Pips gained: 0.0025
Percentage move: 3.11%
BINANCE:HBARUSDT
Asset: Hedera Hashgraph Direction: Long
Timeframe: 5 min
Take Profit 1 price :0.04424
Pips gained: 0.0005
Percentage move: 1.14%
