
Pricing plans and indicator
Trading the Camarilla Pivots
Camarilla Pivot Points is a modified version of the classic Pivot Point.
Camarilla Pivot Points were introduced in 1989 by Nick Scott, a successful bond trader.
The basic idea behind Camarilla Pivot Points is that price has a tendency to revert to its mean until it doesn’t.
What makes it different than the classic pivot point formula is the use of Fibonacci numbers in its calculation of pivot levels.
Camarilla Pivot Points is a math-based price action analysis tool that generates potential intraday support and resistance levels.
Similar to classic pivot points, it uses the previous day’s high price, low price, and closing price.
Camarilla Pivot Points are a set of eight levels that resemble support and resistance values for a current trend.
These pivot points work for all traders and help in targeting the right stop loss and profit target orders.
C = Previous day’s close
H = Previous day’s high
L = Previous day’s low
R4 = (H – L) x 1.1 / 2 + C
R3 = (H – L) x 1.1 / 4 + C
R2 = (H – L) x 1.1 / 6 + C
R1 = (H – L) x 1.1 / 12 + C
S1 = C – (H – L) x 1.1 / 12
S2 = C – (H – L) x 1.1 / 6
S3 = C – (H – L) x 1.1 / 4
S4 = C – (H – L) x 1.1 / 2
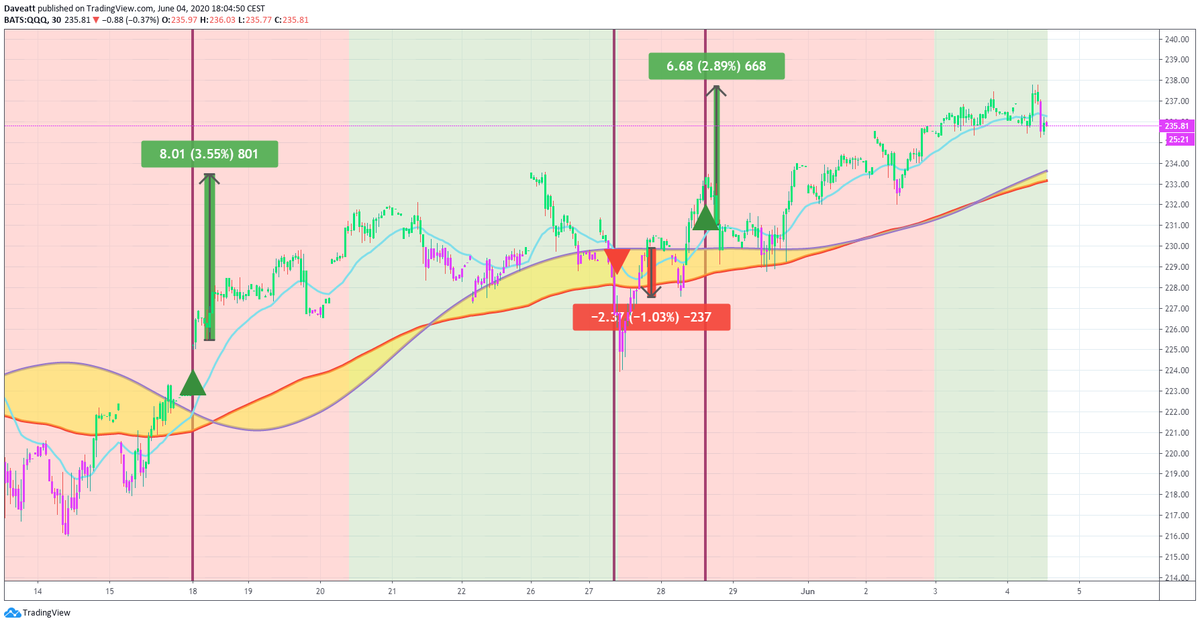
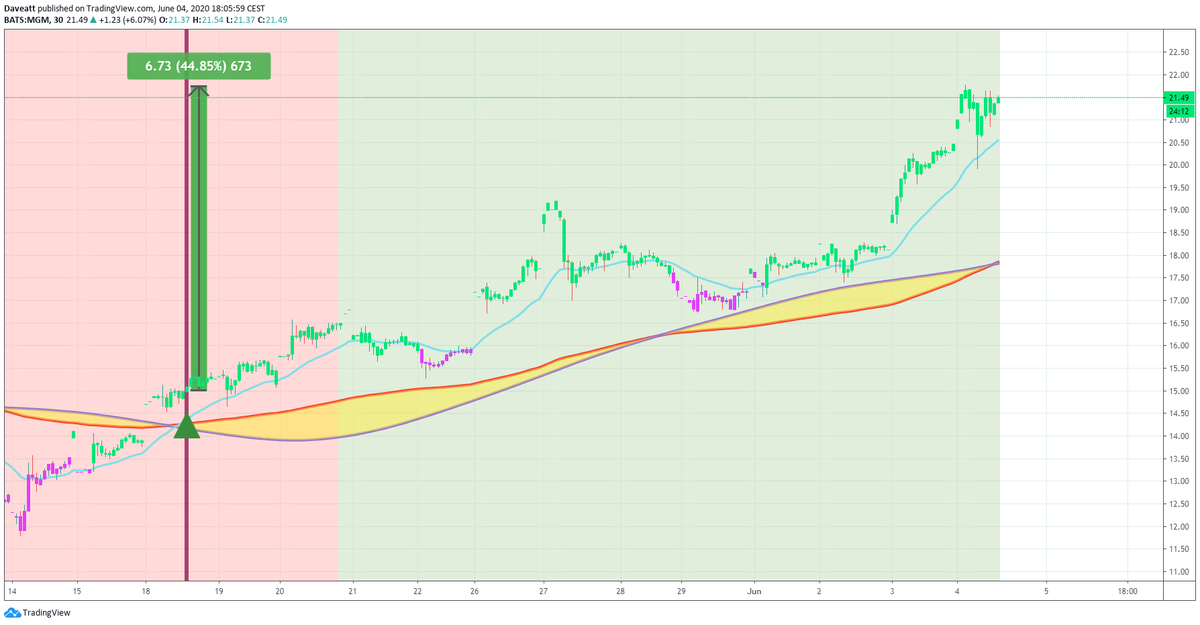
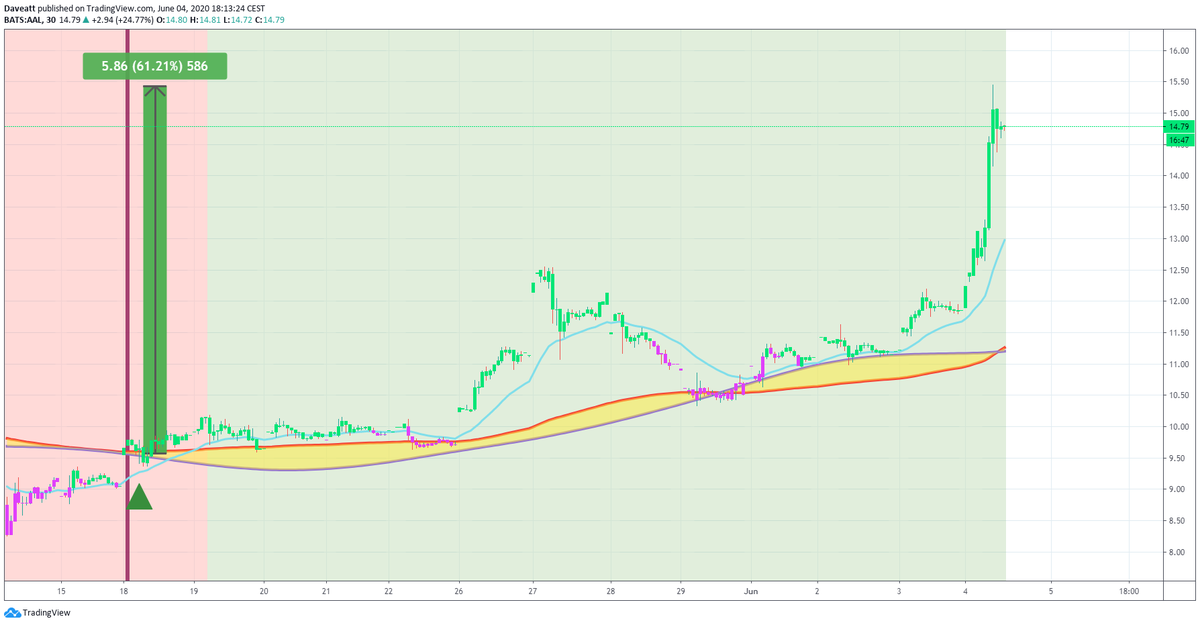
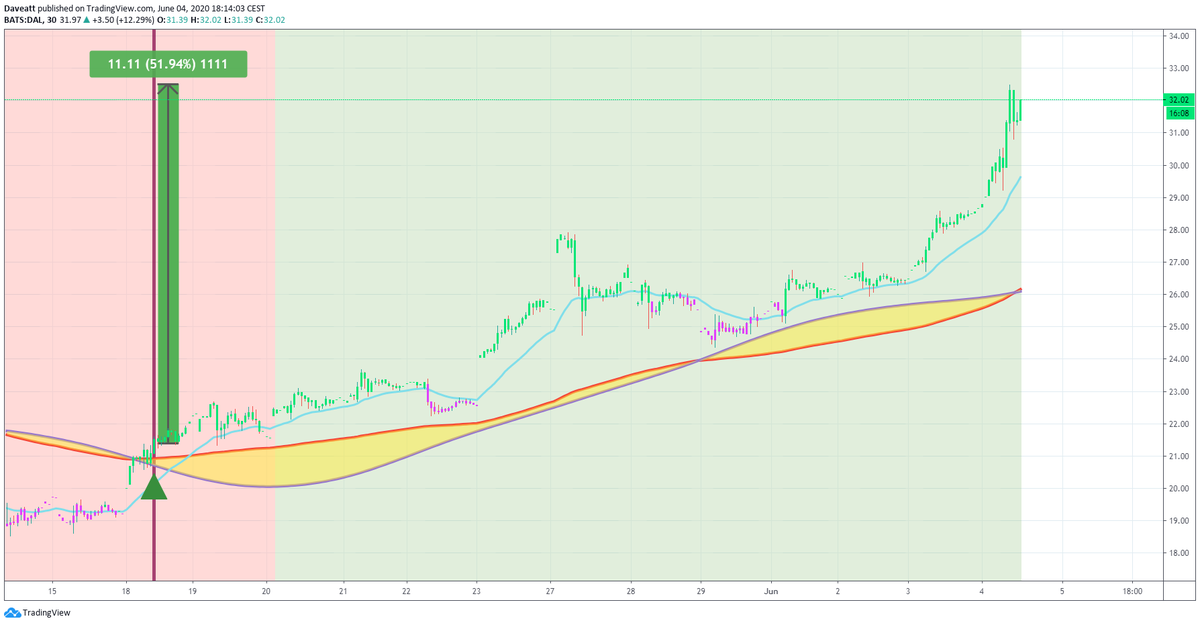
We're trading Stocks Options with the Algo Builder Crypto Intraday 5-minutes and Algo Builder Stocks 30-minutes
A quite note
Each screenshot below is clickable and can be enlarged for better visibility
Twitter Public Signals


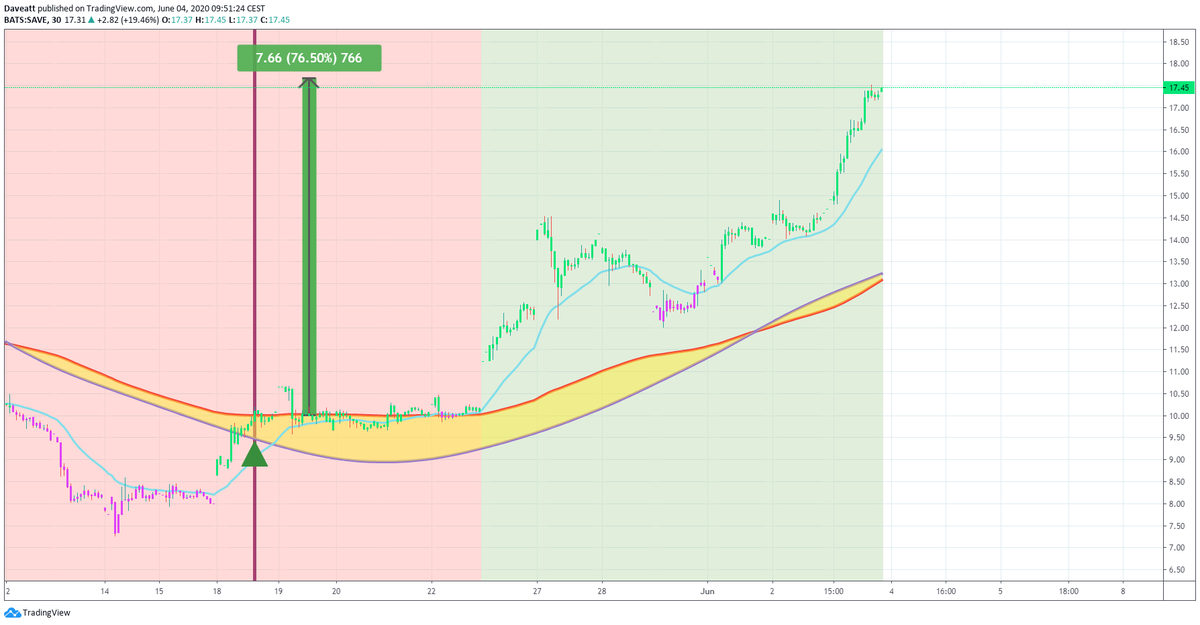
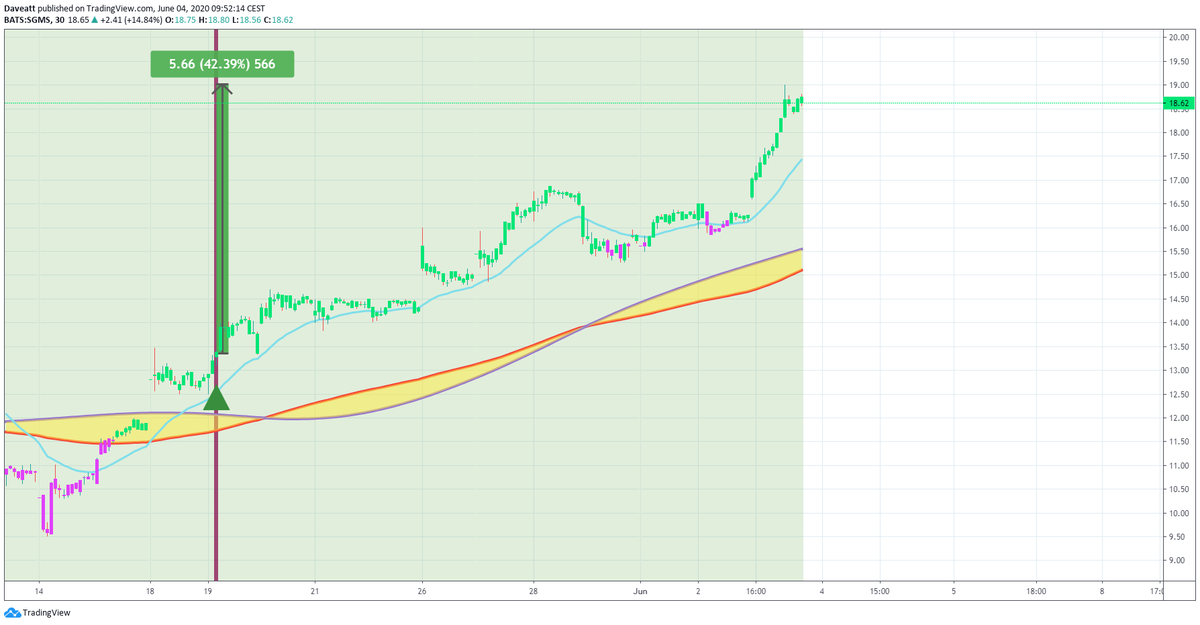
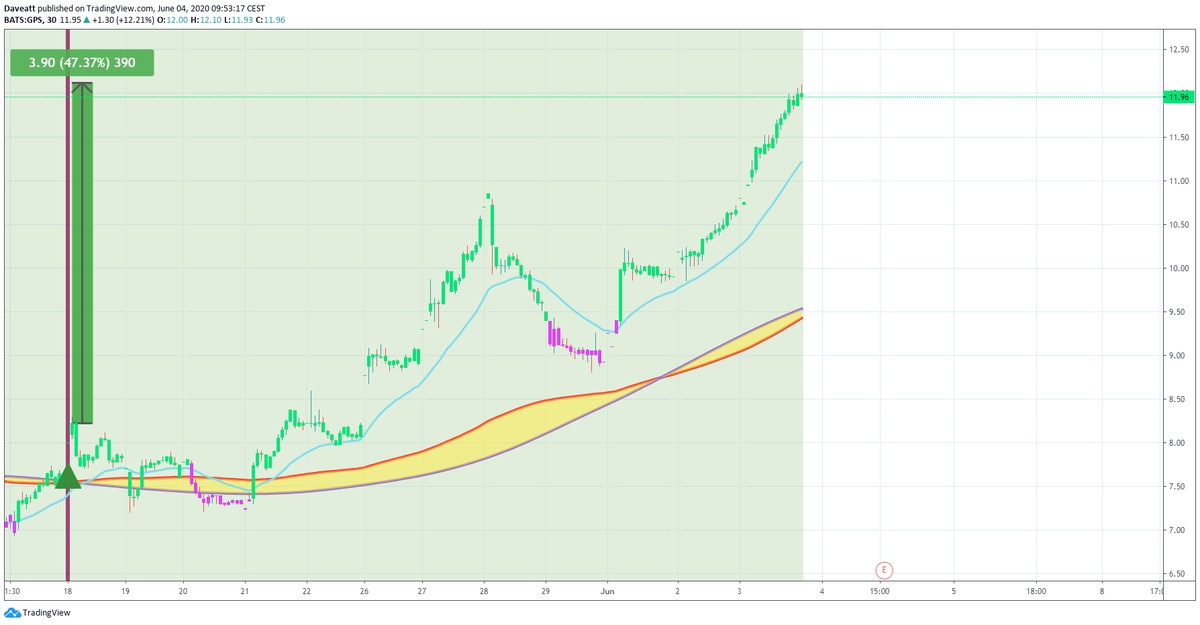
SAVE SGMS GPS
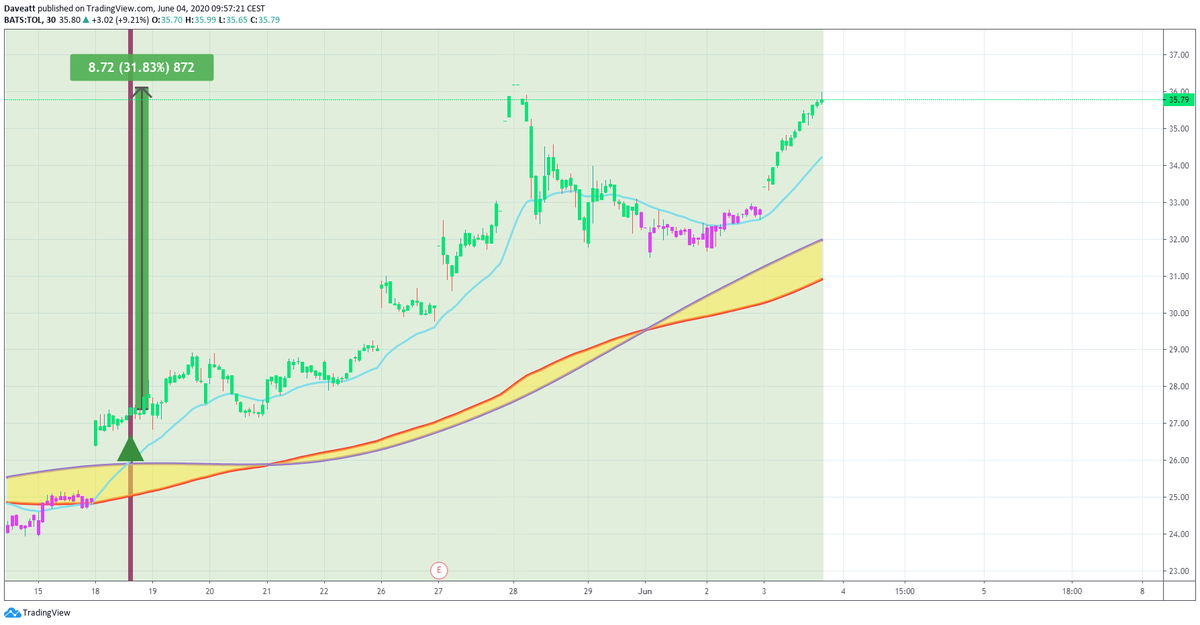
HBI VER TOL


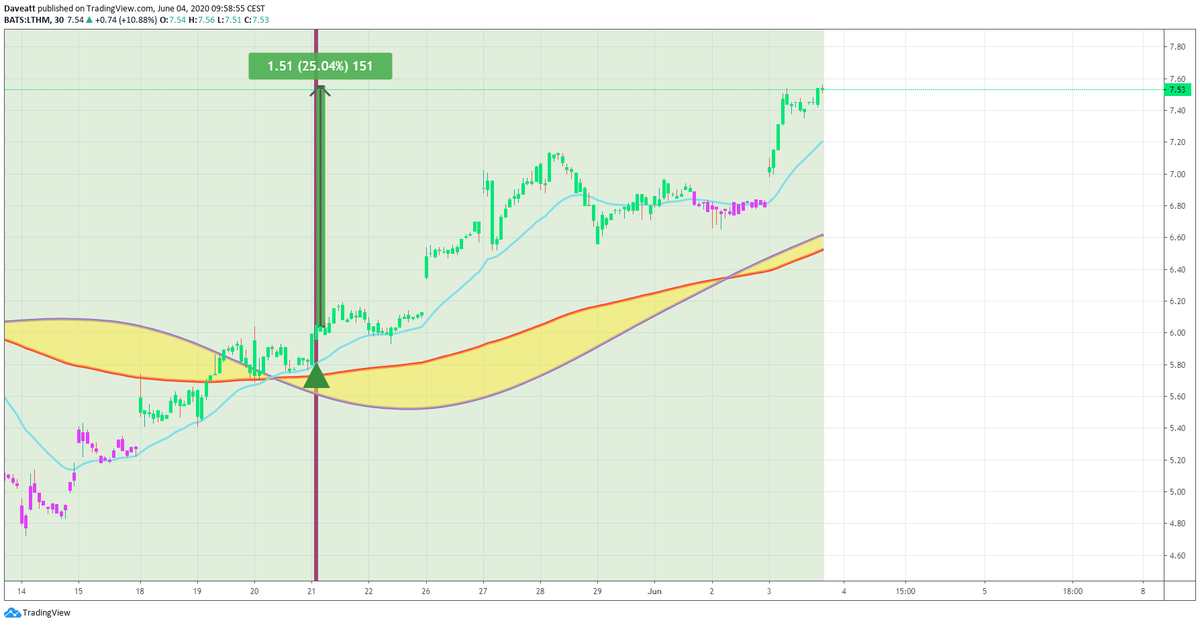
LTHM KIM WYNN


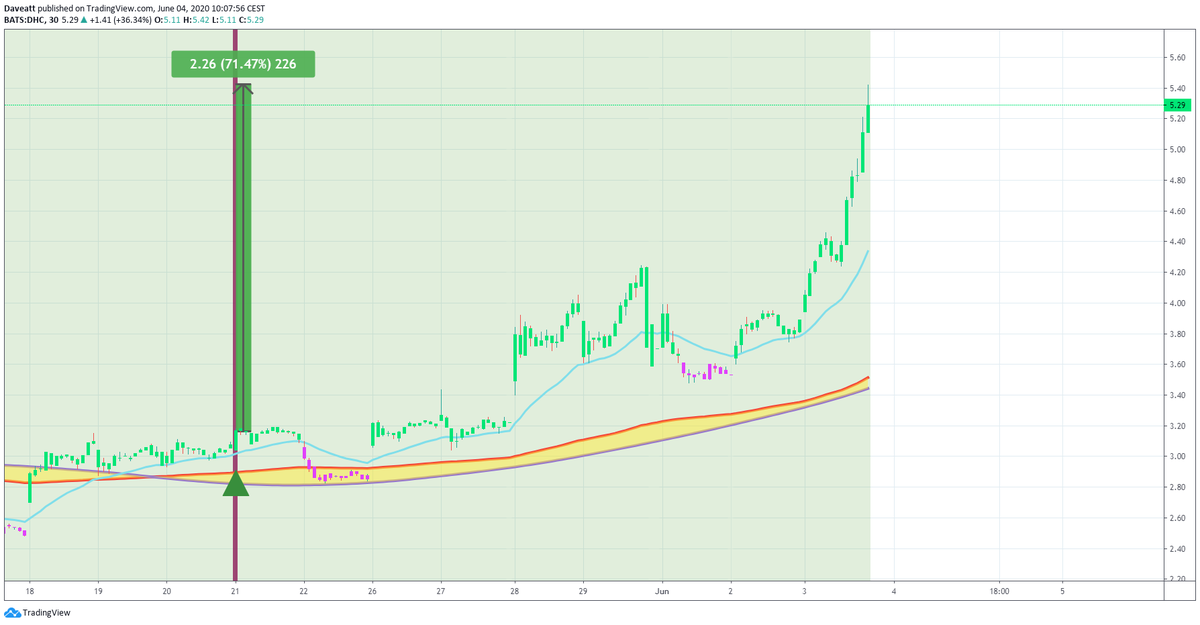
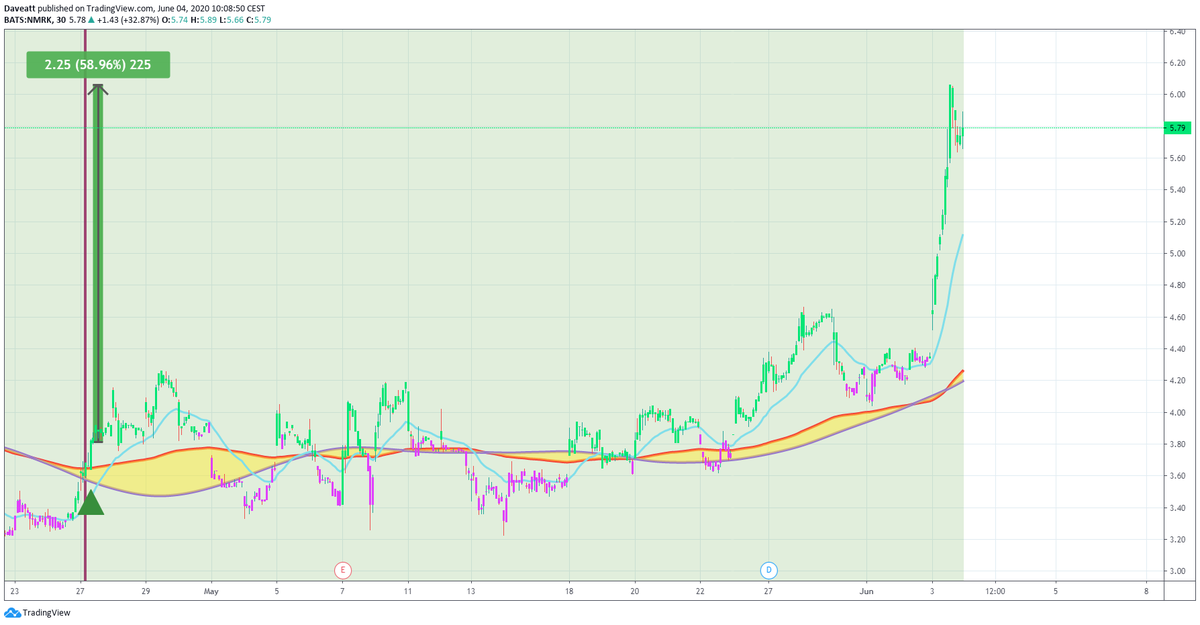
DHC NMRK DBI

Discord signals
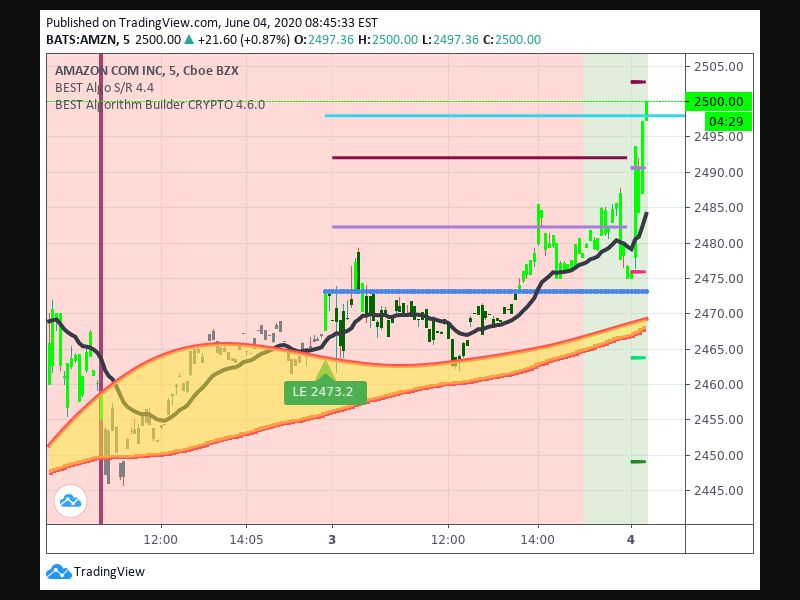
Asset: Amazon Direction: Long
Timeframe: 5 min
Take Profit 1 price: 2497.93
Pips gained: 25.59999999999991
Percentage move: 1.04%
Twitter Signals
Nasdaq trades


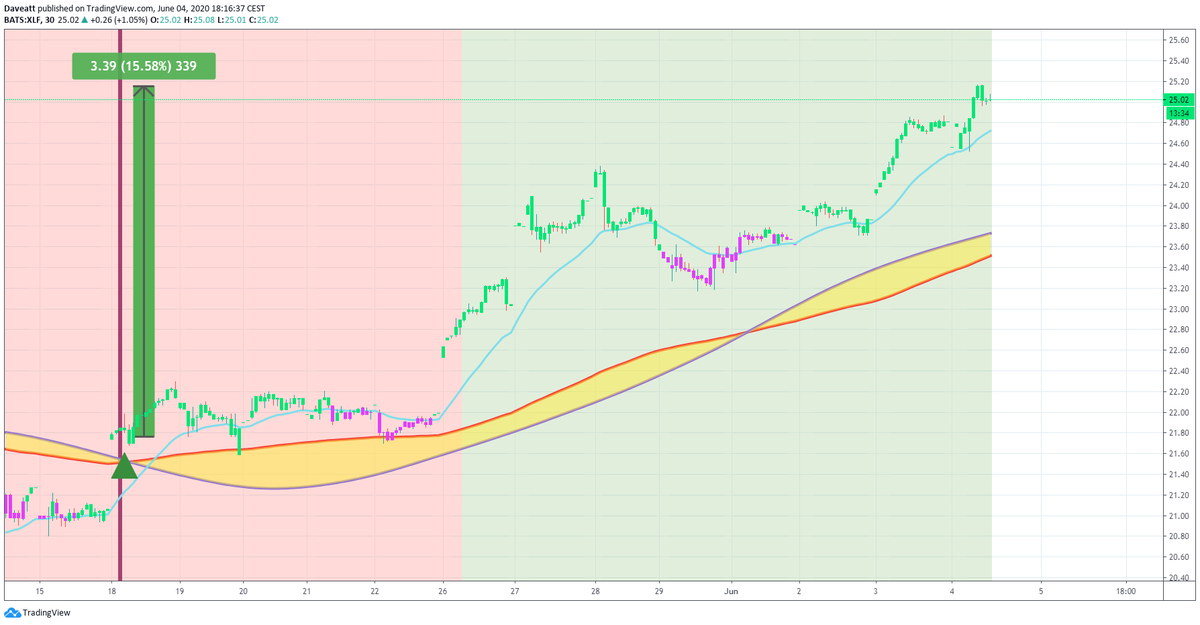
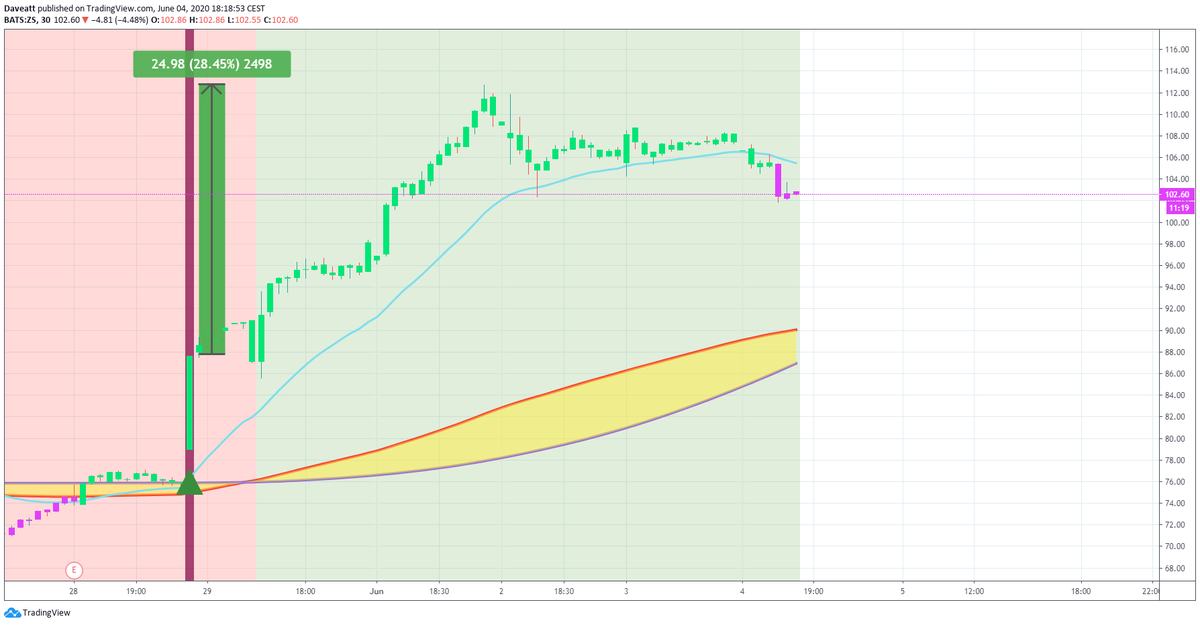
XLF XLE ZS

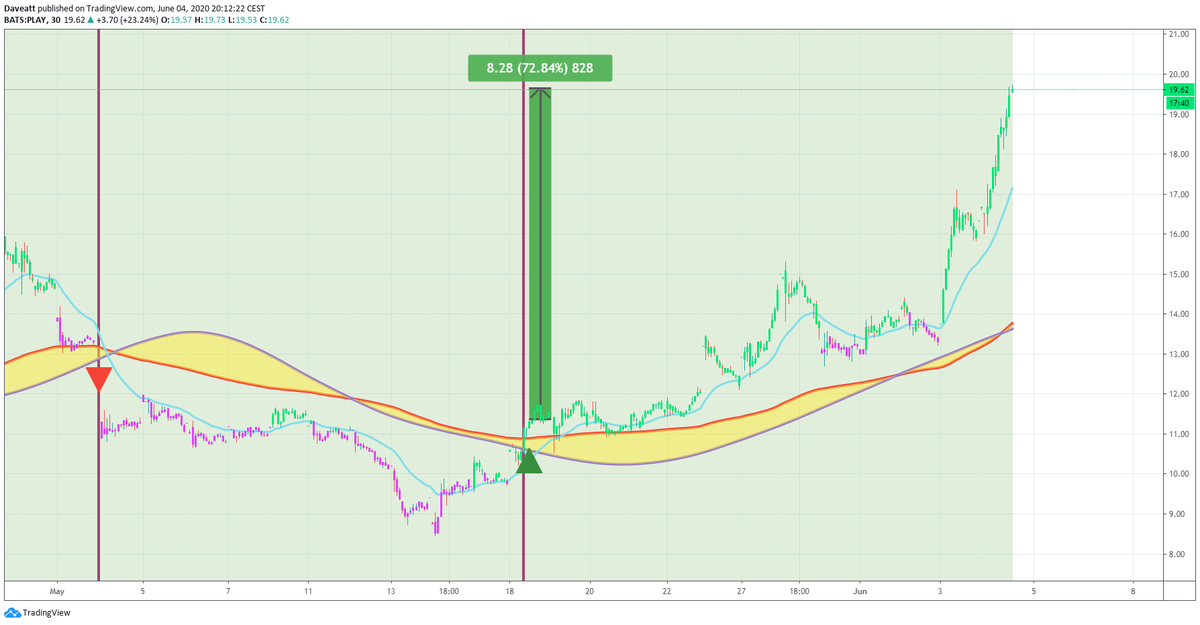
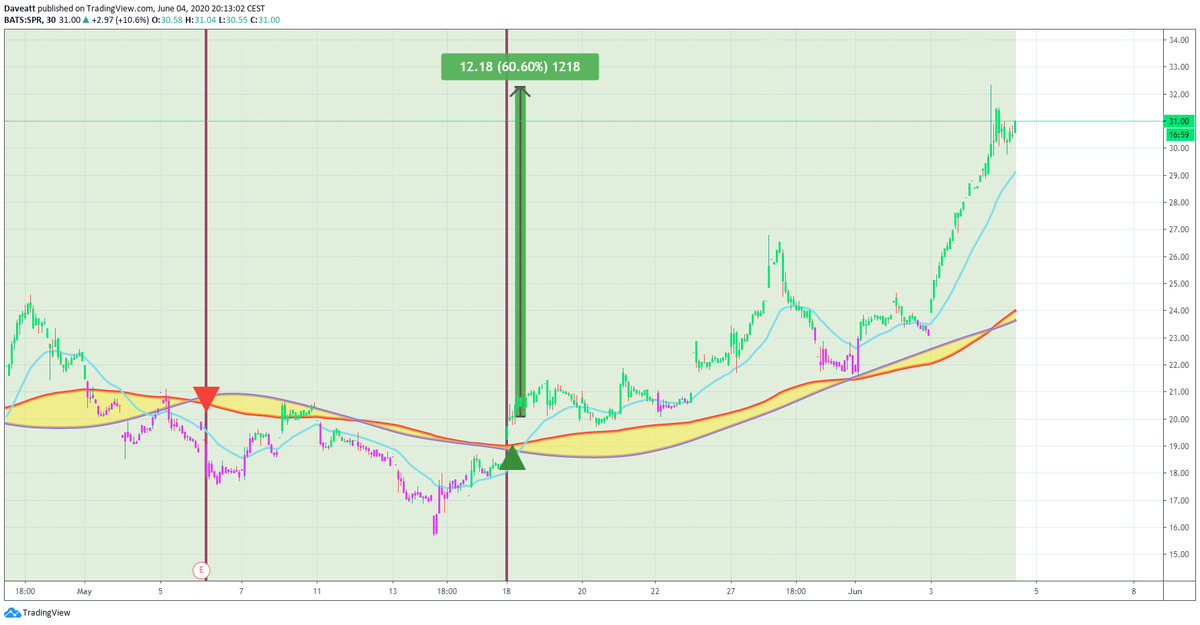
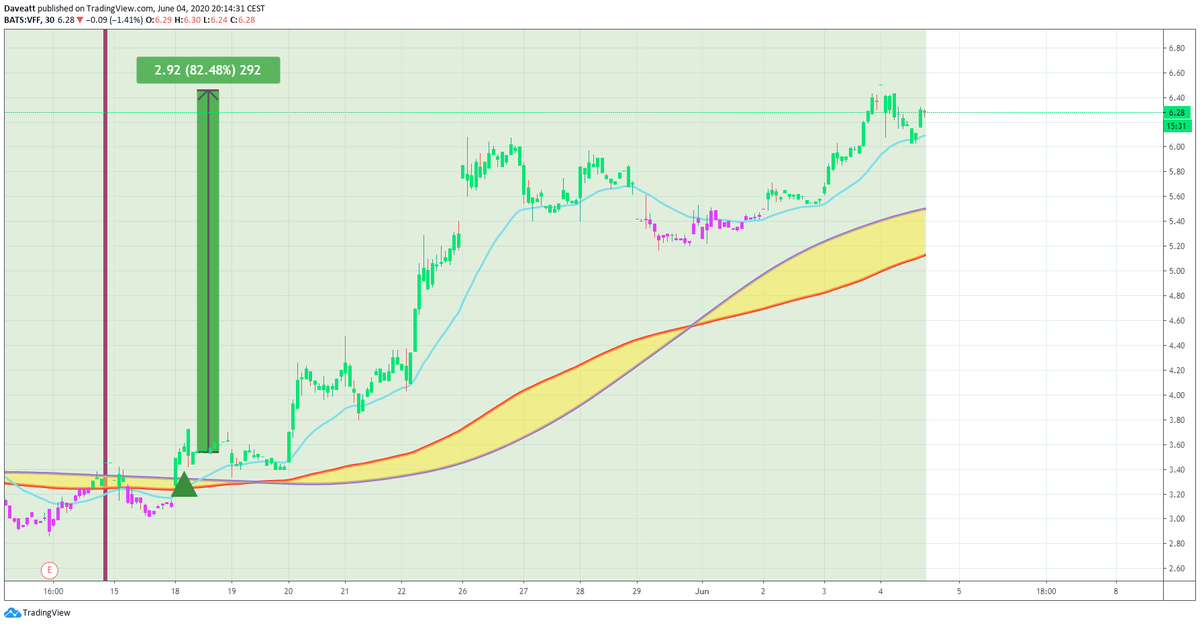
PLAY SPR VFF
Intraday signals given by our algorithm on these stocks on our 30-minutes charts ☀️☀️☀️ With BTI Indicator, trade what you see, not what you think! stocks bti NDQ NASDAQ100 nasdaq NYSE