
Introduction
Bulls suffer for 3 years since the 2017 top with $BTC at $20000 (on Coinbase)
We had some good volatility in 2018 and then in the first half of 2019, and then as you all know, Bitcoin used to range at the 10K, then 6K then 3K levels for months.
Without volatility and volume, a trader cannot do much magic here.
It was quite hard to trade Bitcoin and alts due to the lack of interest from the institutions and retail.
But now, the good fundamental news are released almost on a daily basis.
Paypal enabling payment with crypto for their US customers, Microstrategy, Grayscale, Square, ... investing massively in Bitcoin.
Plus, we know have many more "blockchain" indicators to gauge the health of the crypto ecosystem.
Investors now have the ability to predict the approximate tops/bottoms based on blockchain data (NVT, stock-to-flow model, etc.)
Bitcoin Chart Analysis
Let's start with a technical analysis.
On the hourly chart, we got a signal at $10800 and the setup now is still bullish with the black EMA above the cloud, green Leading trend.
We're above all SMAs meaning it's an algorithmic ATH
On the 2H chart, we have a similar picture. Everything is still bullish and there is no sign of a "TOP" yet.
Compared to 2017, now we have very cool indicators such as the Open Interest and the NVT from Willy Woo.
The Open Interest is at an all-time-high showing this move is mostly driven by spot traders - this is a very healthy sign
With many derivatives brokers implementing a KYC (Know-Your-Customer) rule and some of them being under the SEC radar (example with Bitmex), the crypto market is healing and becomes healthy.
Blockchain Analysis
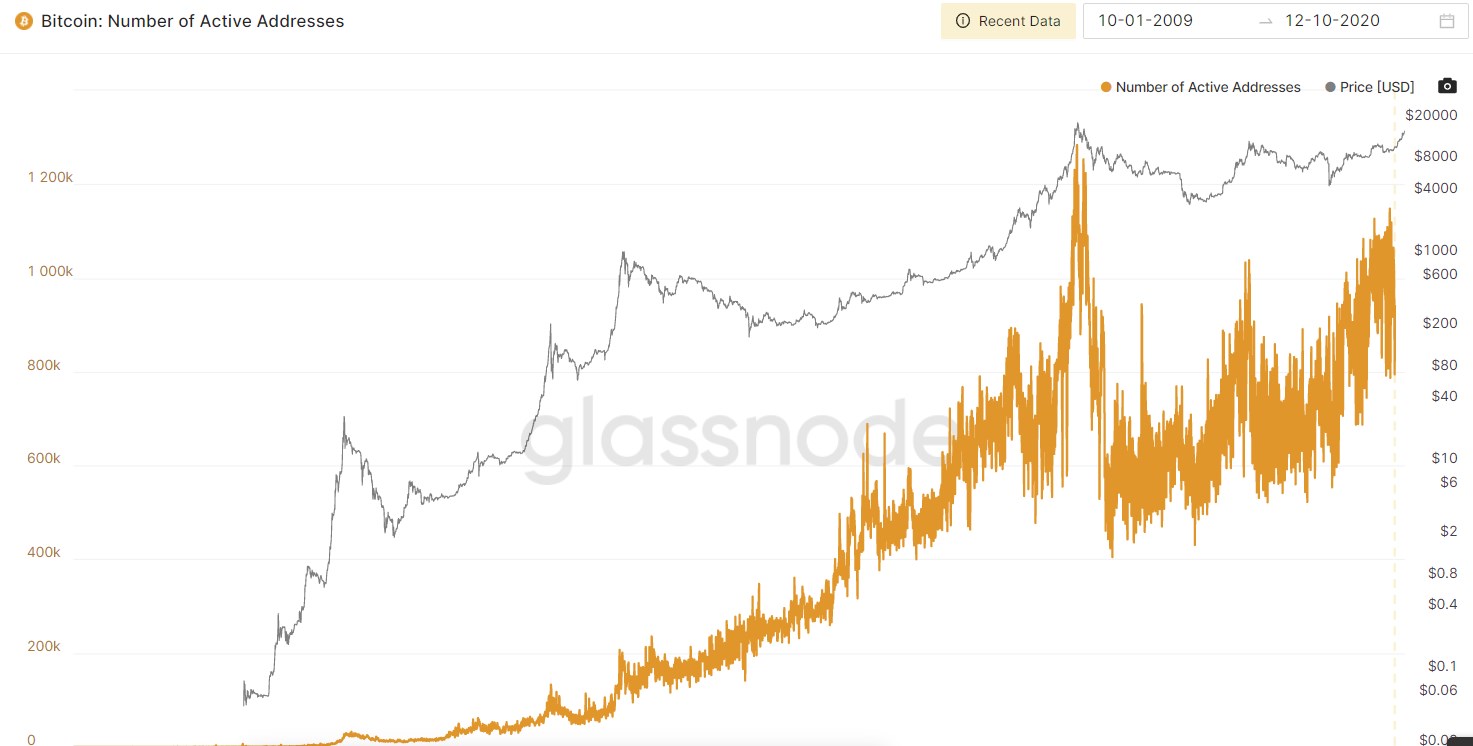
Bitcoin Total Addresses
Using Glassnode, we see the number of Bitcoin addresses keeps increasing.
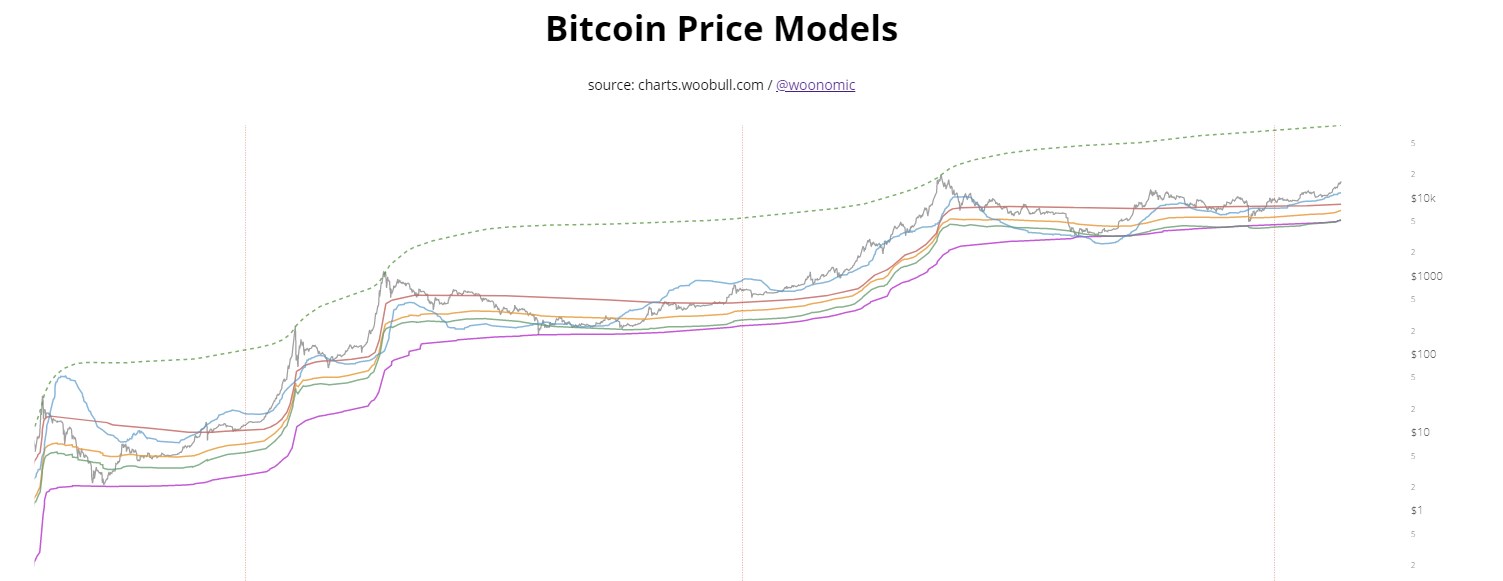
Using Willy Woo BTC Price models chart, we see the numerous Bitcoin Price models are bullish and that Bitcoin is primed to go much higher.
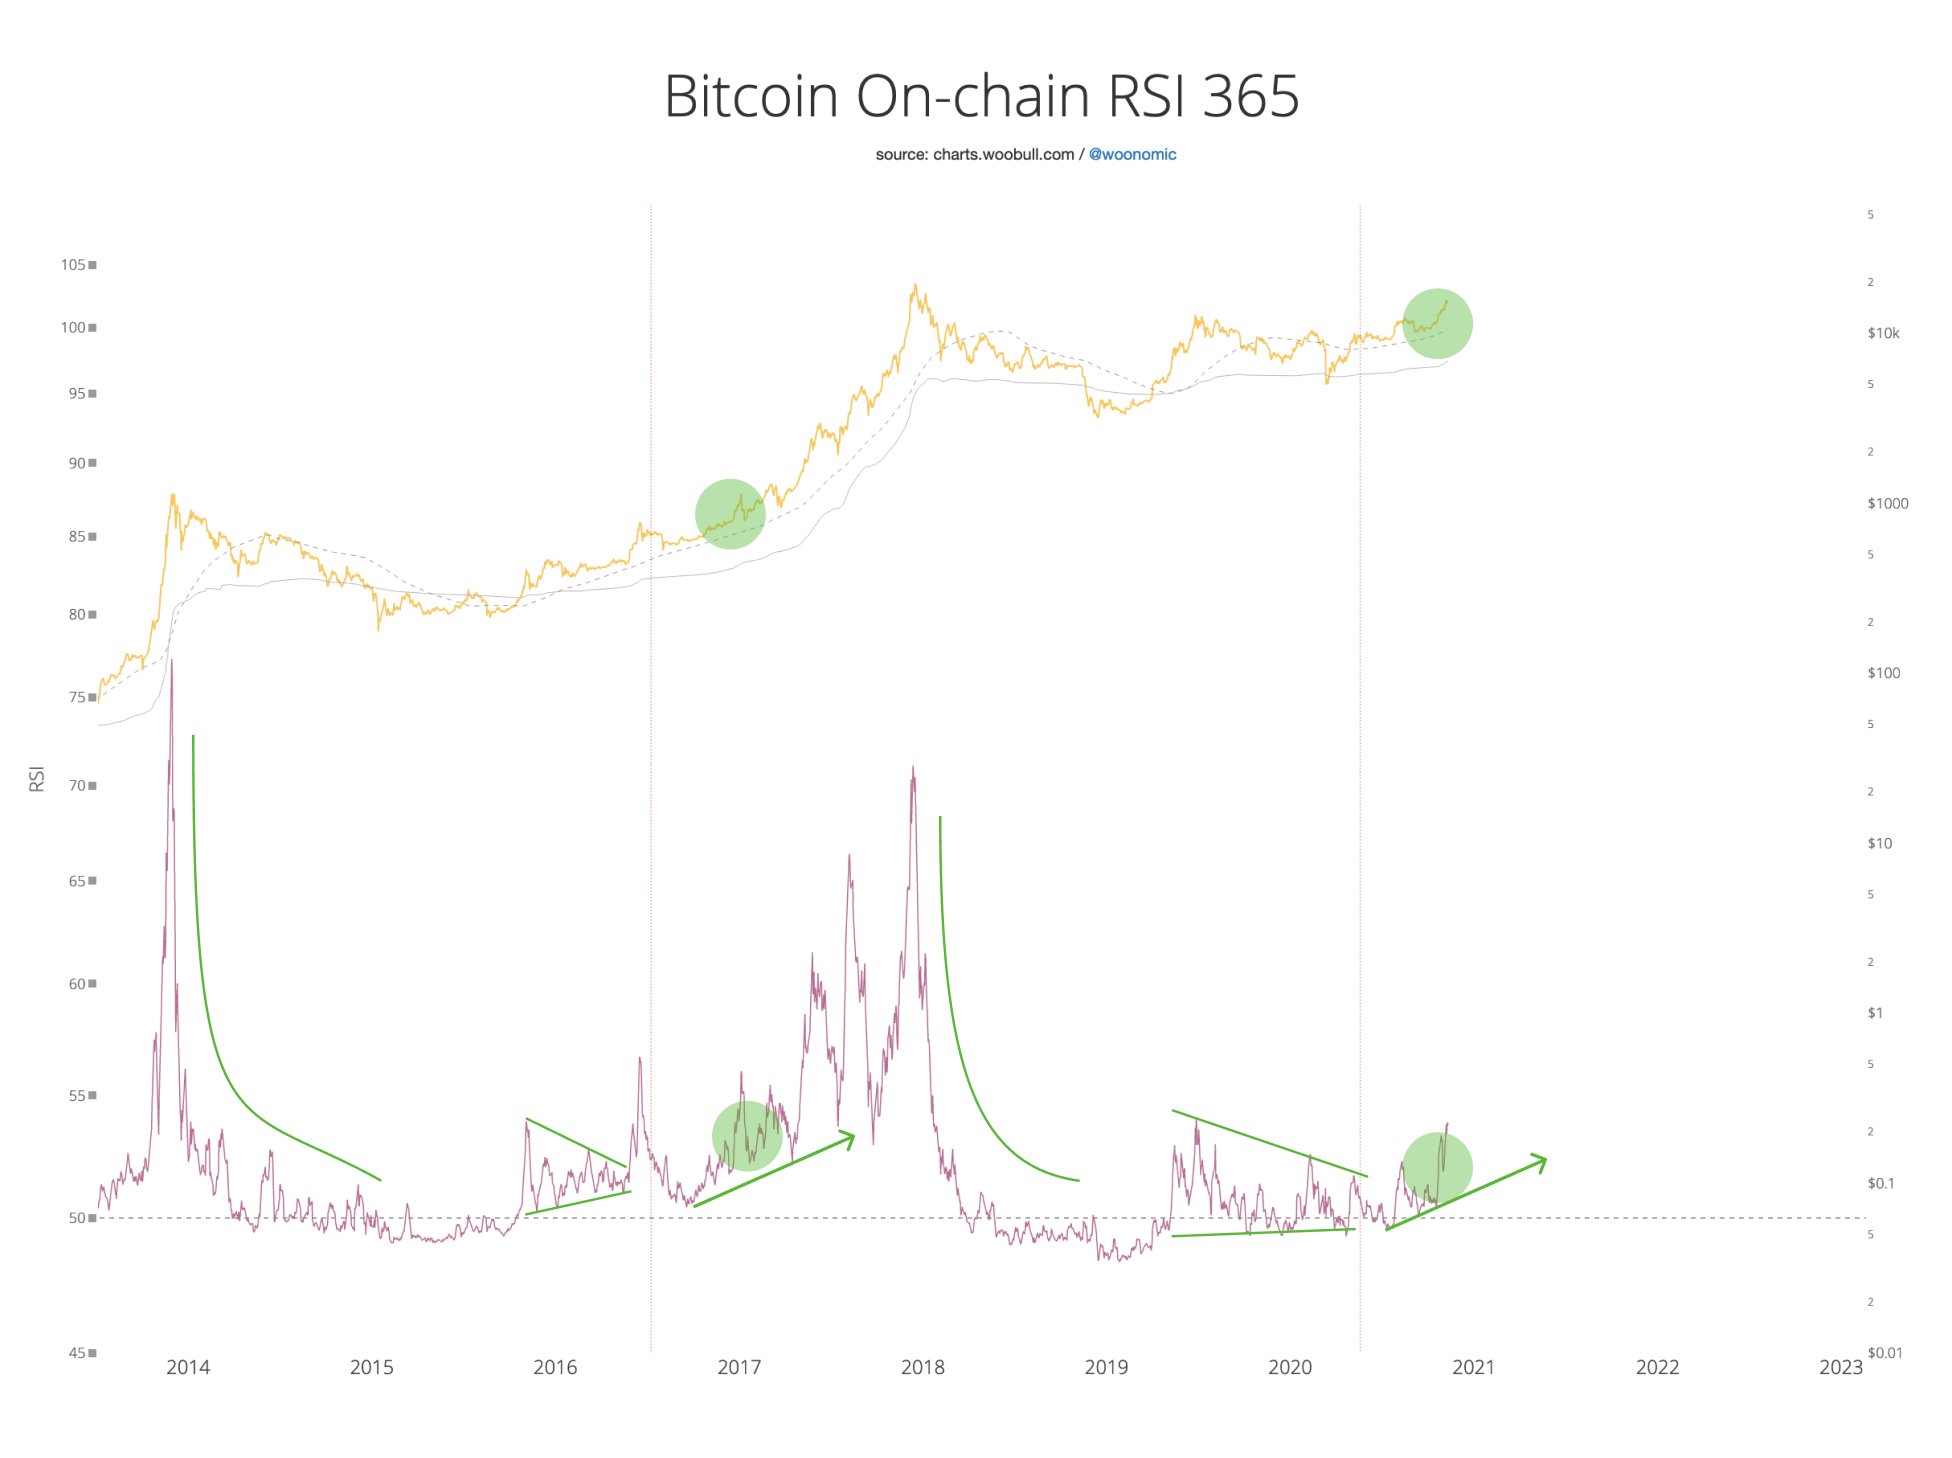
Bitcoin On-Chain Relative Strength Index
Green circle denotes where we are in this macro cycle. Start of the main bull run (in case it isn't already obvious).
BTC's on-chain Relative Strength Index is just warming up.
Red verticals are the halvenings, providing the bullish supply shock impulse.
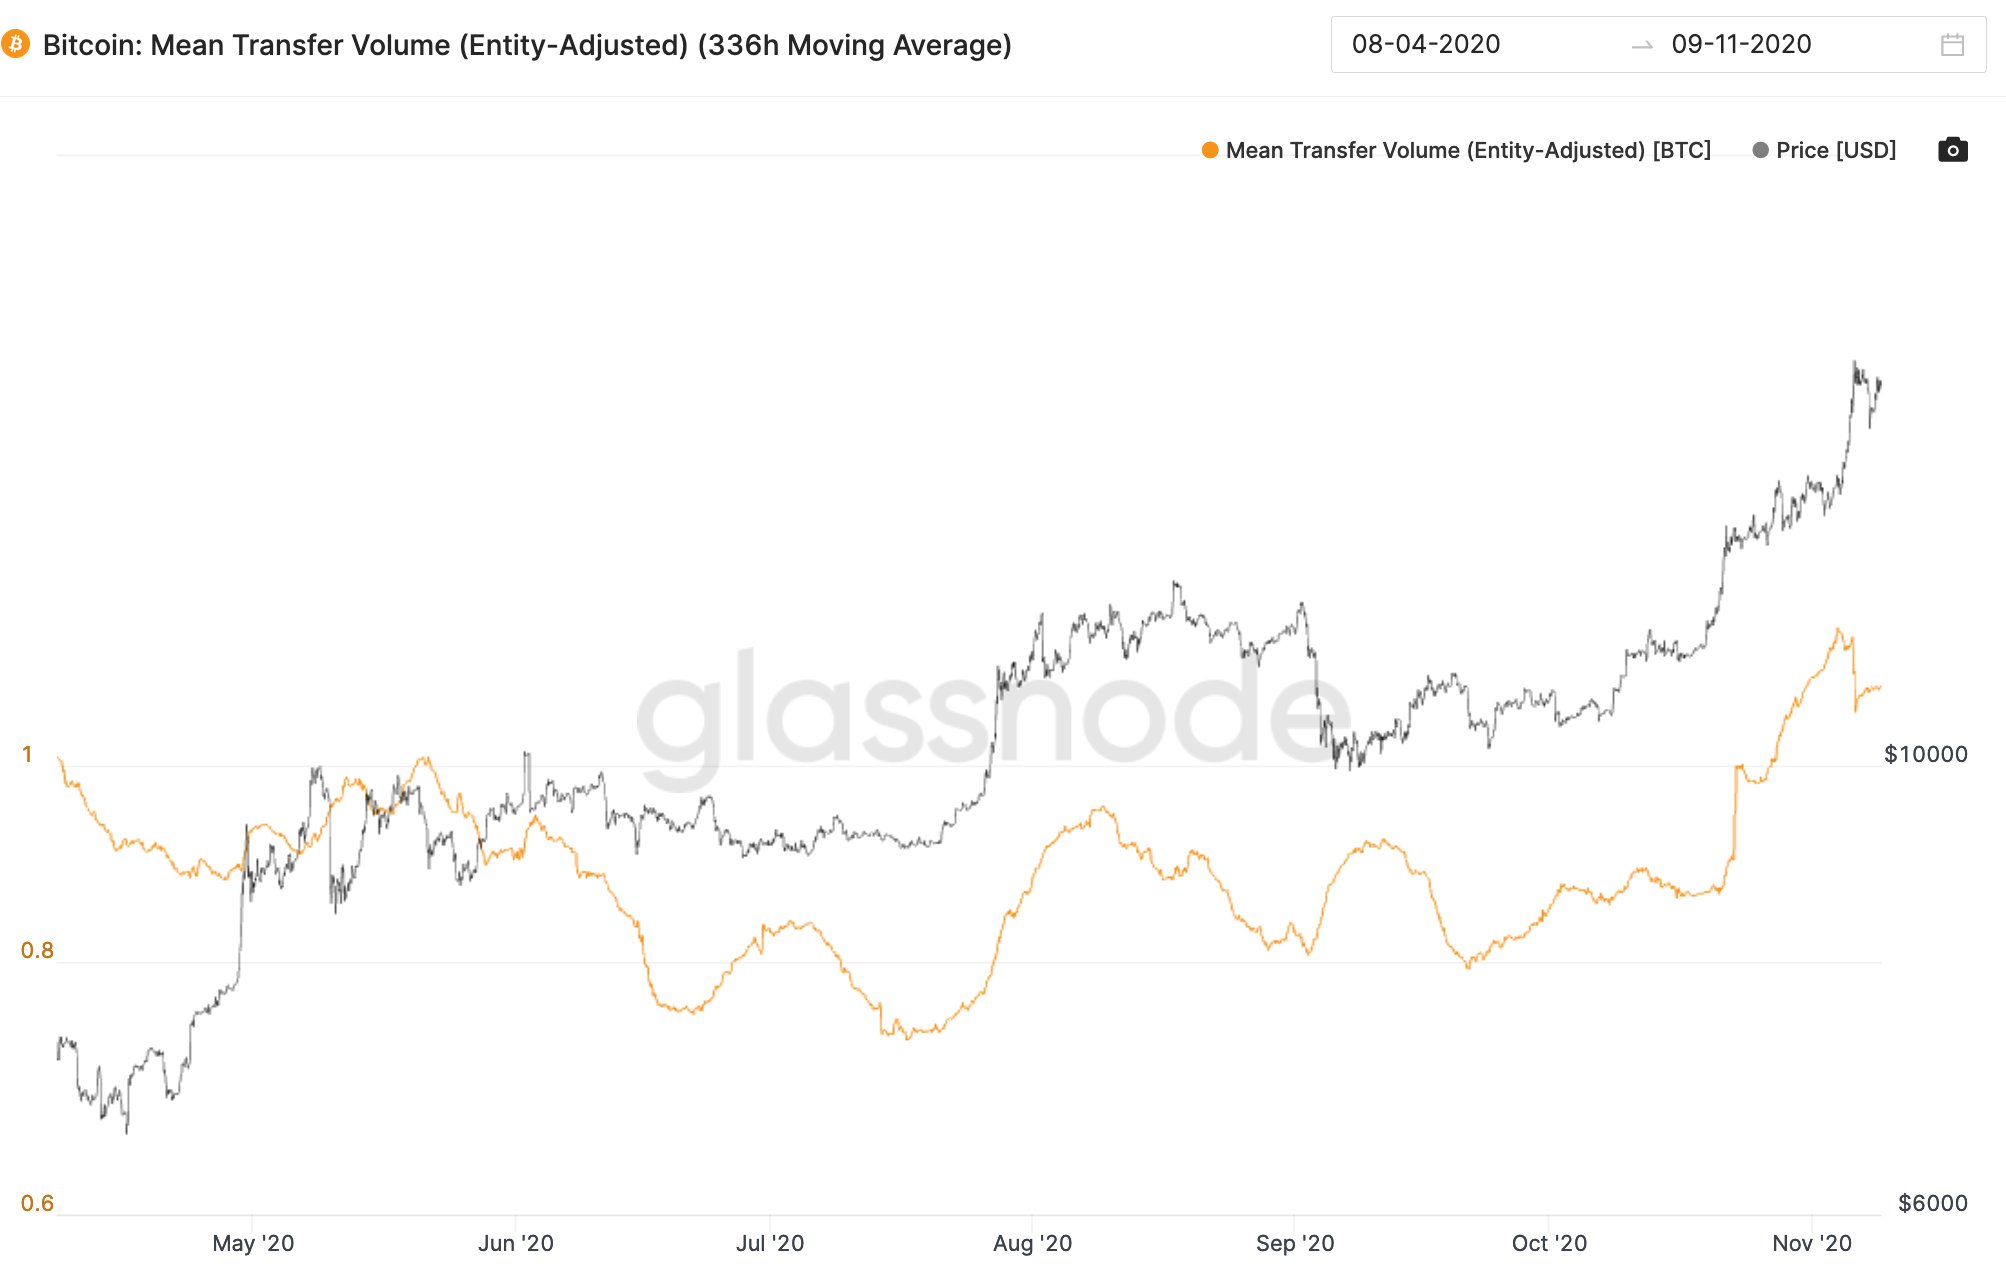
Bitcoin Mean Transfer Volume
Who has been buying this rally? It's smart money...
High Net Worth Individuals.
You can see the average transaction value between investors taking a big jump upwards. OTC desks are seeing this too.
Bitcoin is still in it's stealth phase of its bull run.
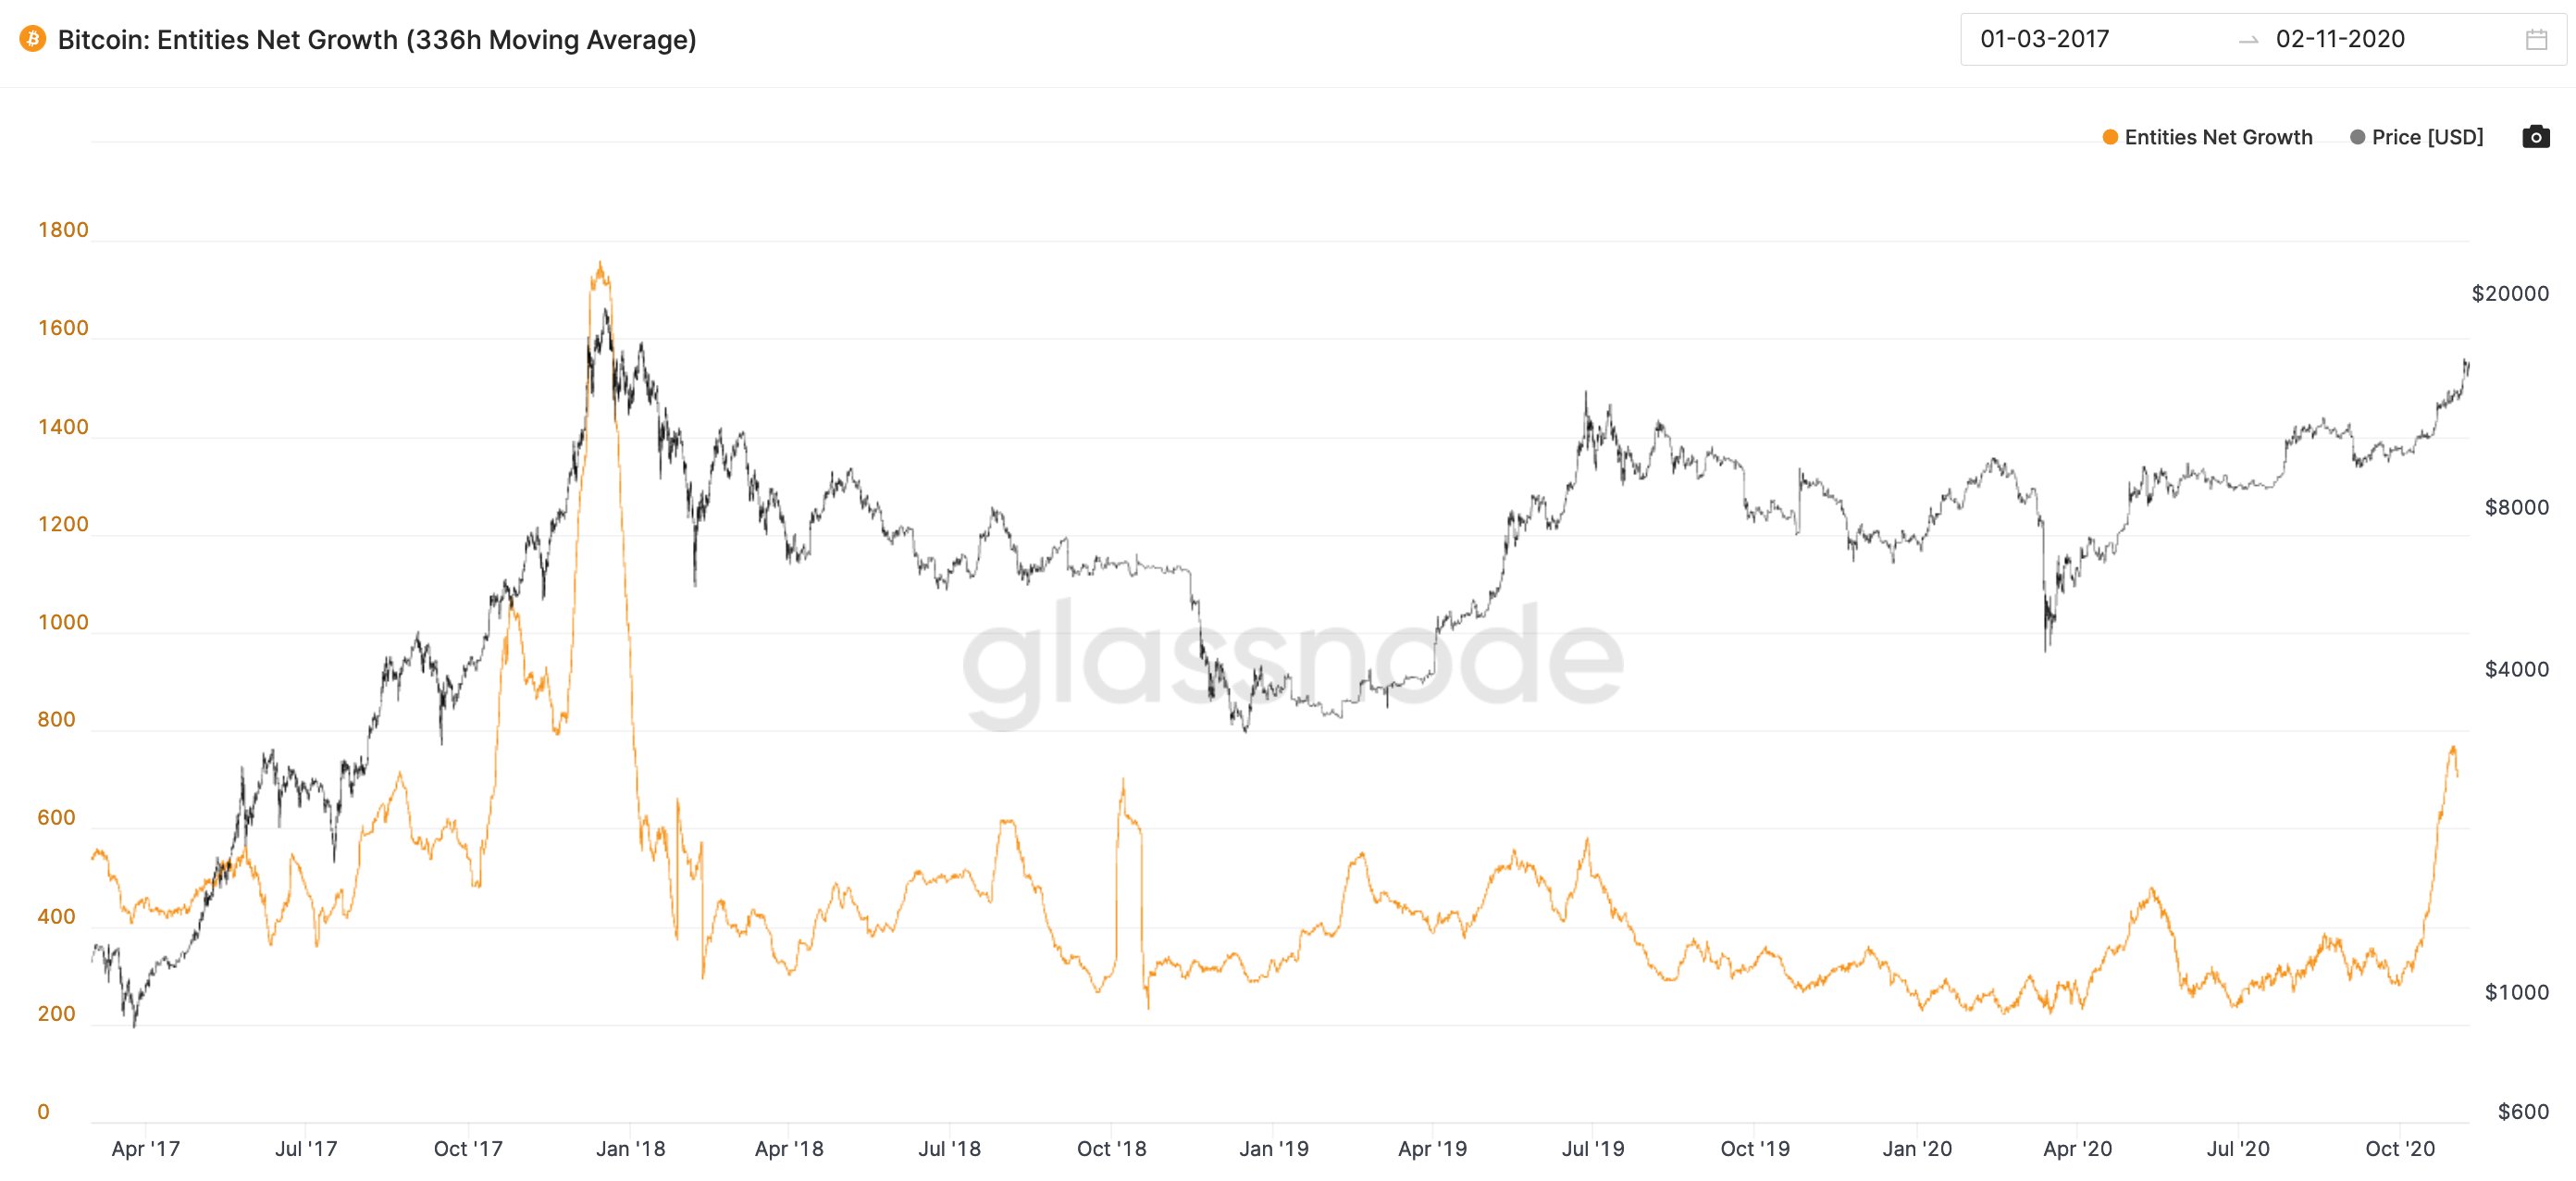
Bitcoin Entity Net Growth
Best of all we are not just seeing smart money flow in, it's NEW smart money.
Orange line is the rate of new investors coming in per hour previously unseen before on the blockchain.
It's seriously bullish.
Conclusion
From an investment perspective, Bitcoin looks extremely interesting
When an asset is hyped on television and social media, that's usually when retail traders join the party and provide liquidity to the whales -leading to interesting intraday and swing trades
A quick note
Each screenshot below is clickable and can be enlarged for better visibility
Our recent Crypto trades shared on Discord and Twitter
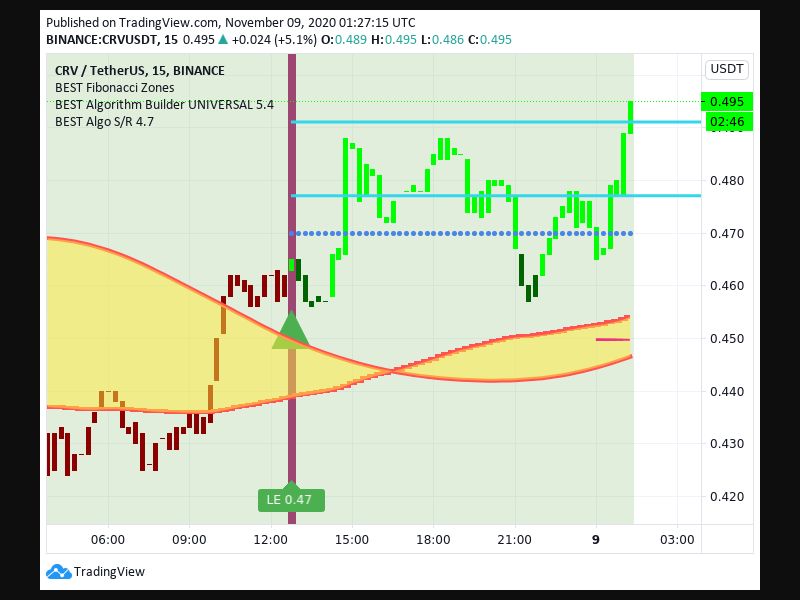
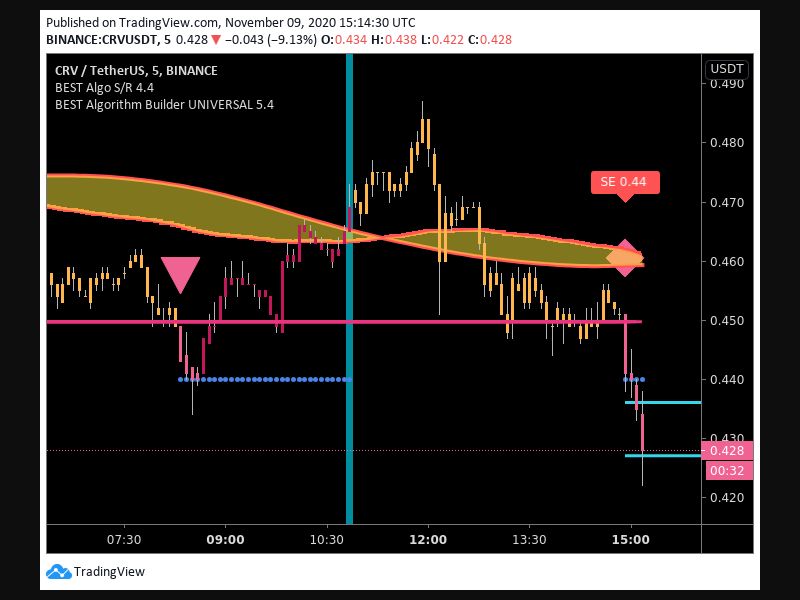
BINANCE:CRVUSDT
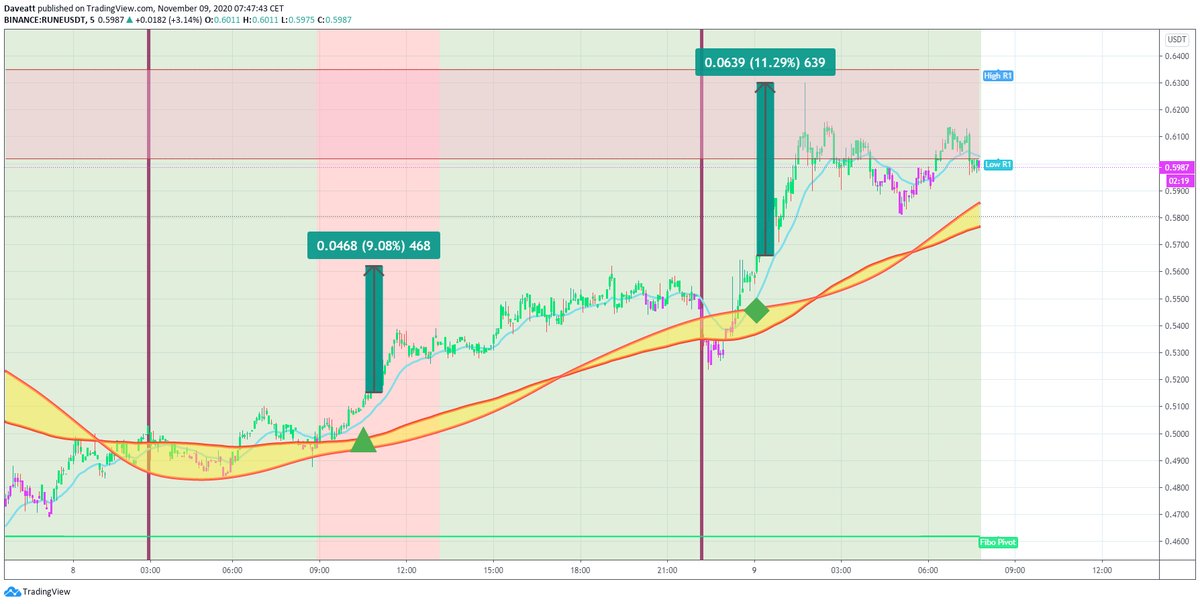
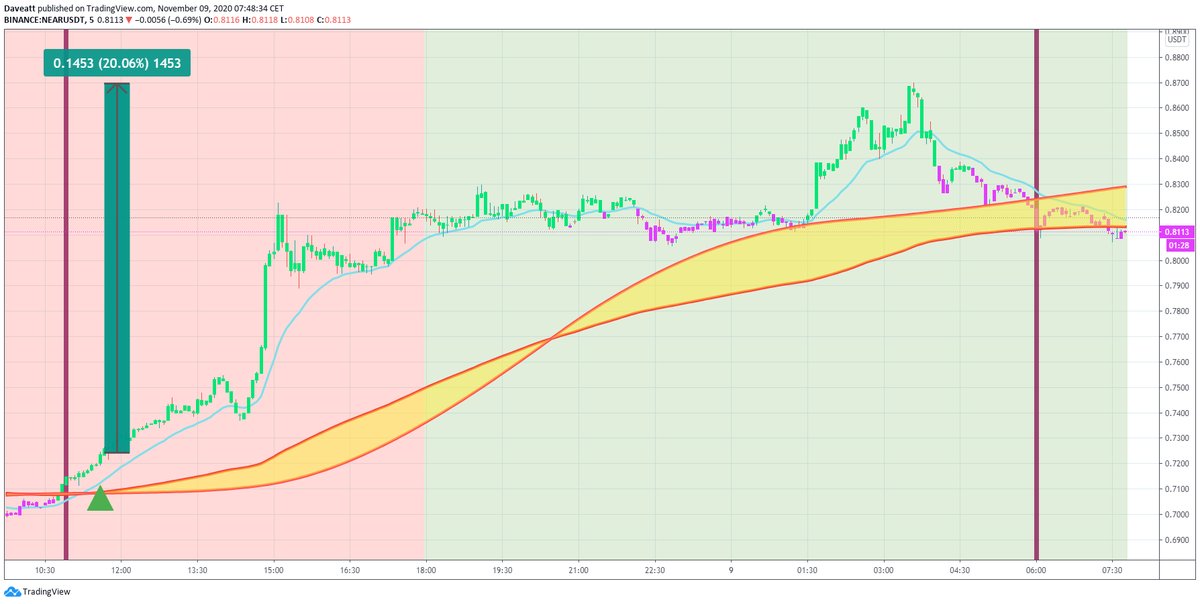
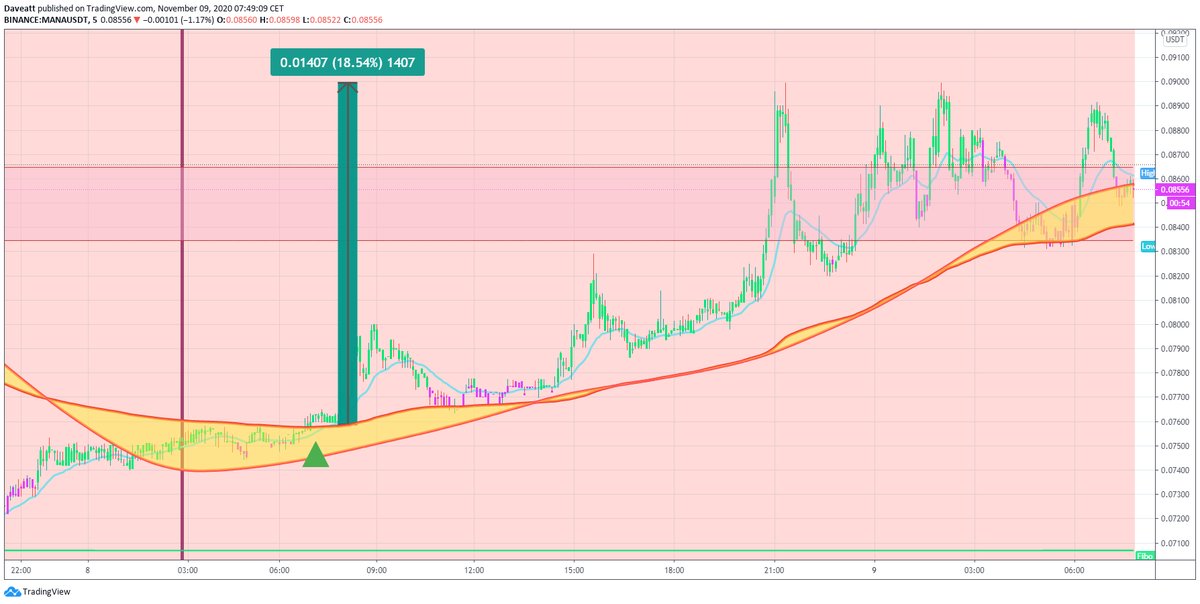
RUNE NEAR MANA m5
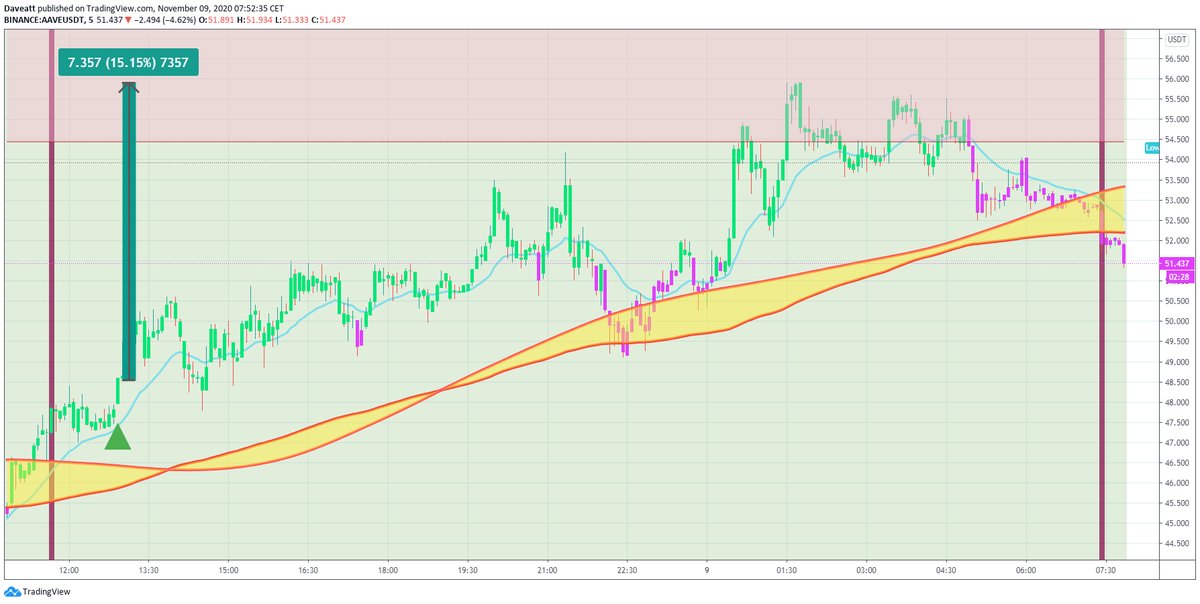
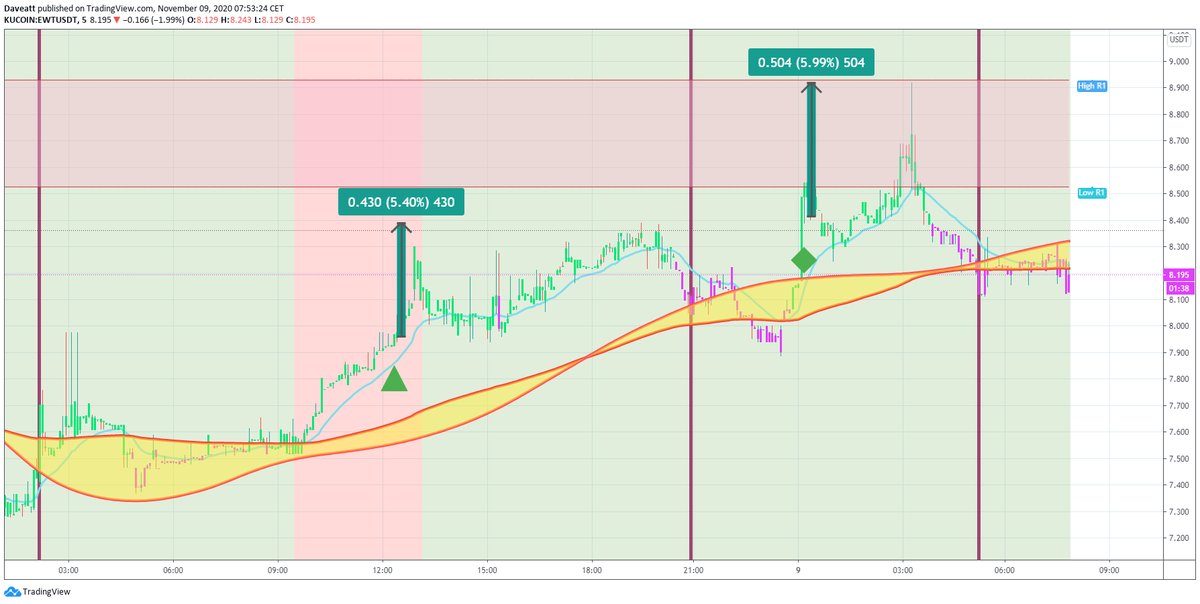
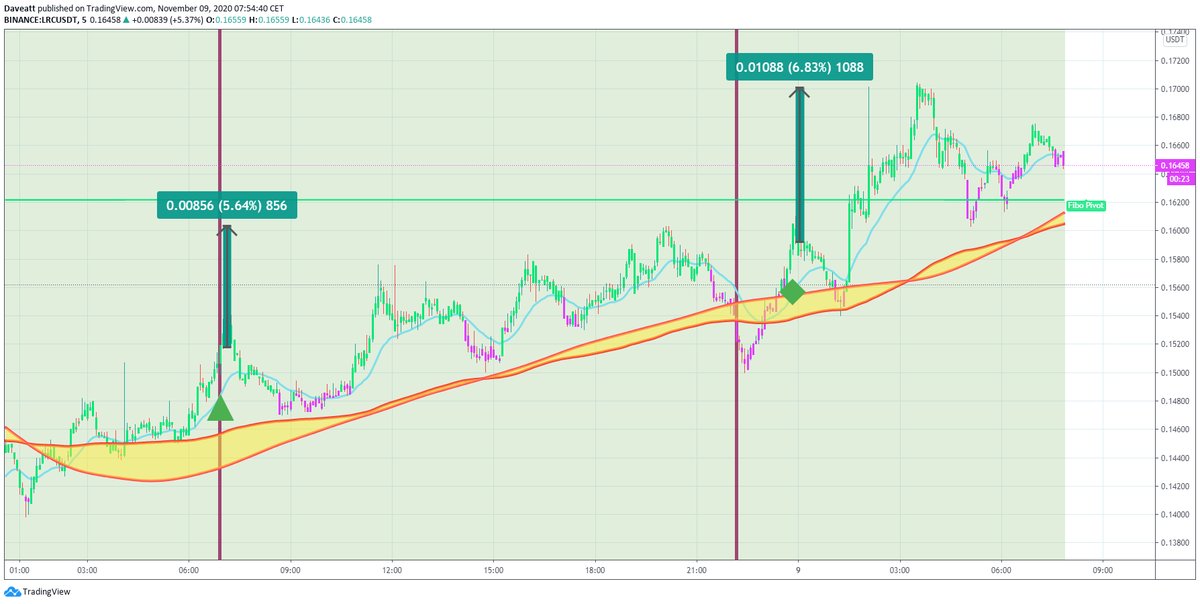
AAVE EWT LRC m5
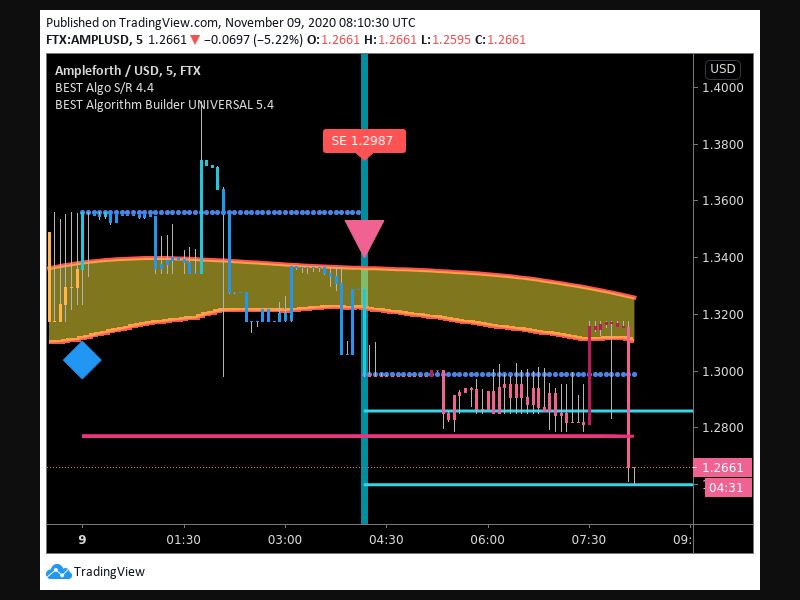
FTX:AMPLUSD
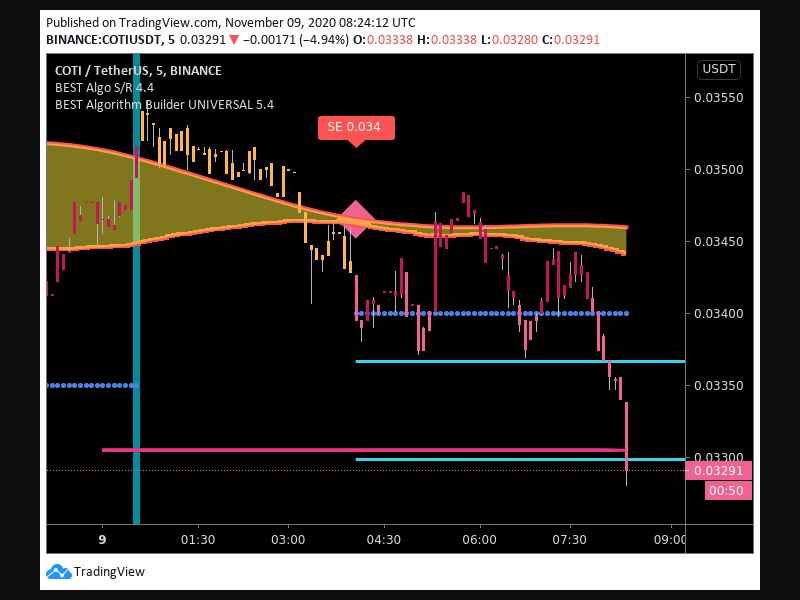
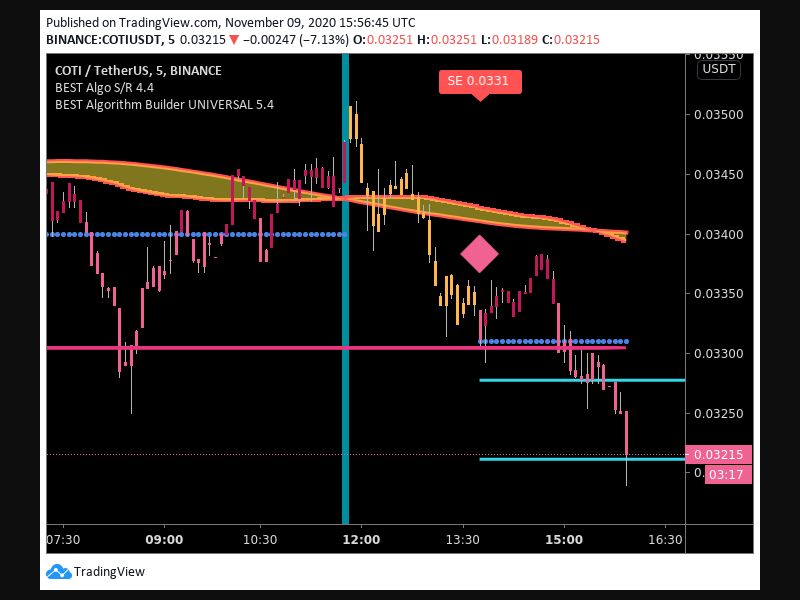
BINANCE:COTIUSDT
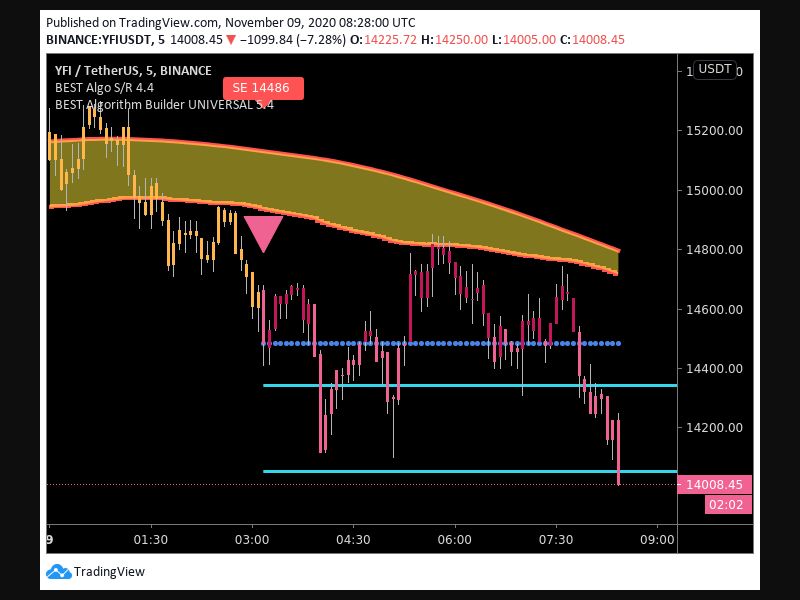
BINANCE:YFIUSDT
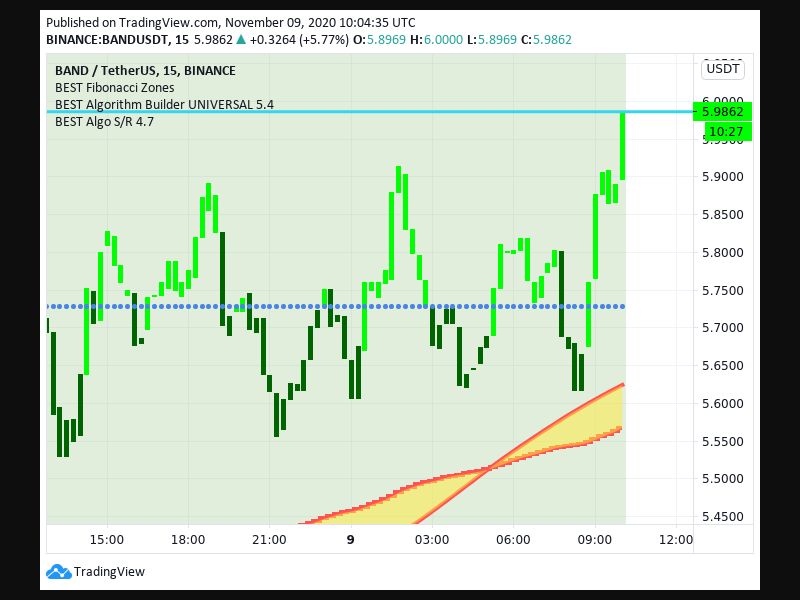
BINANCE:BANDUSDT
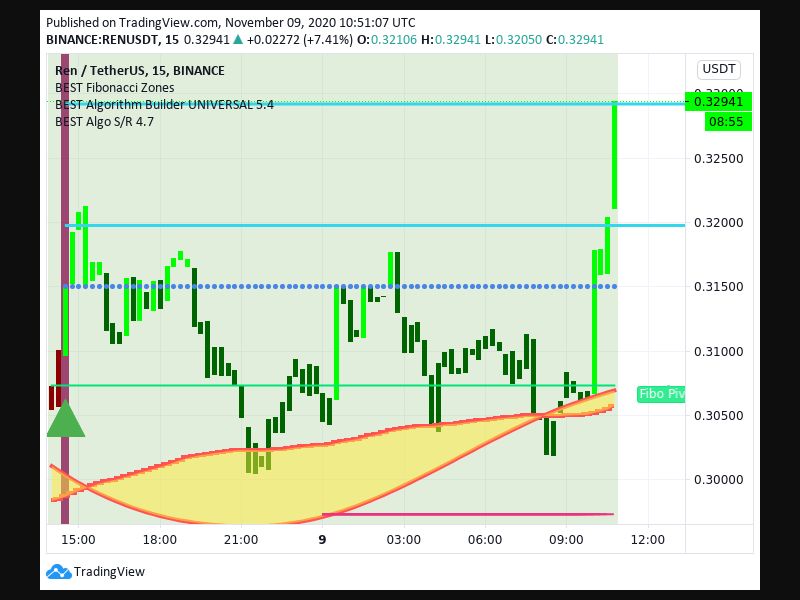
BINANCE:RENUSDT
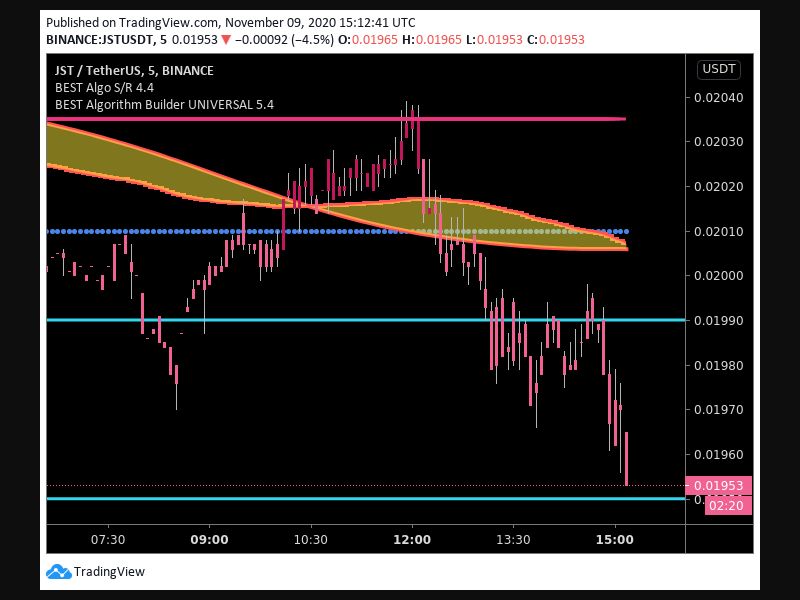
BINANCE:JSTUSDT
BINANCE:CRVUSDT
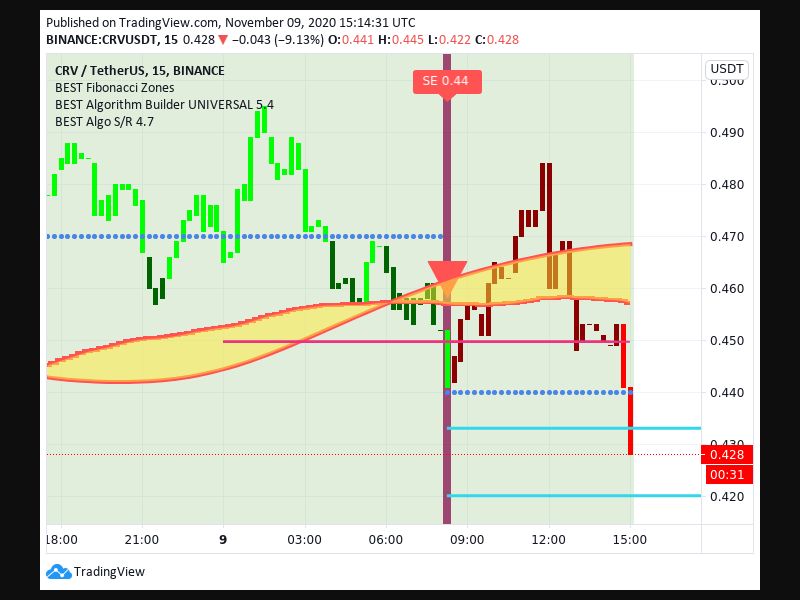
BINANCE:CRVUSDT
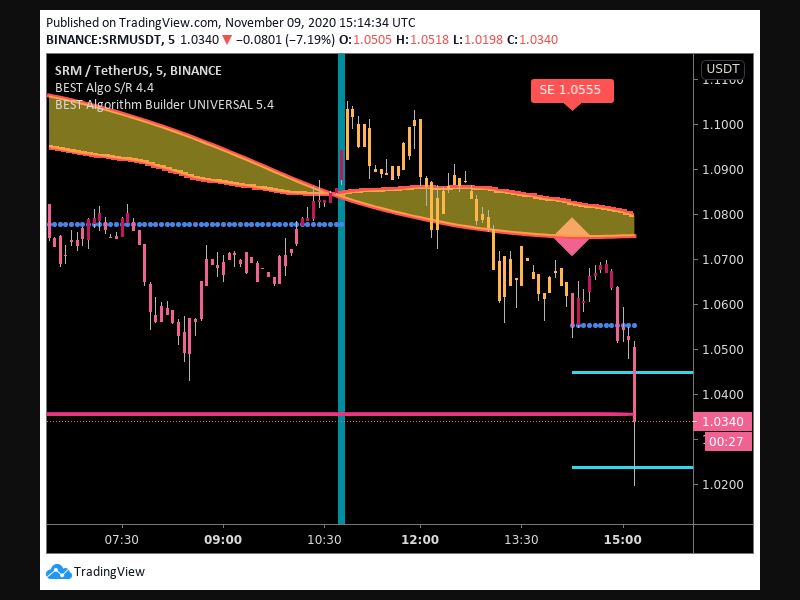
BINANCE:SRMUSDT
BINANCE:COTIUSDT
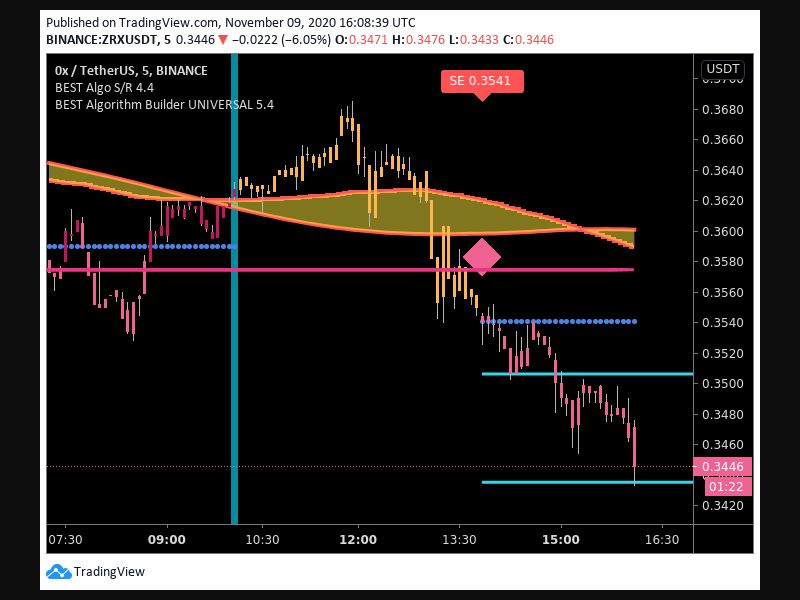
BINANCE:ZRXUSDT
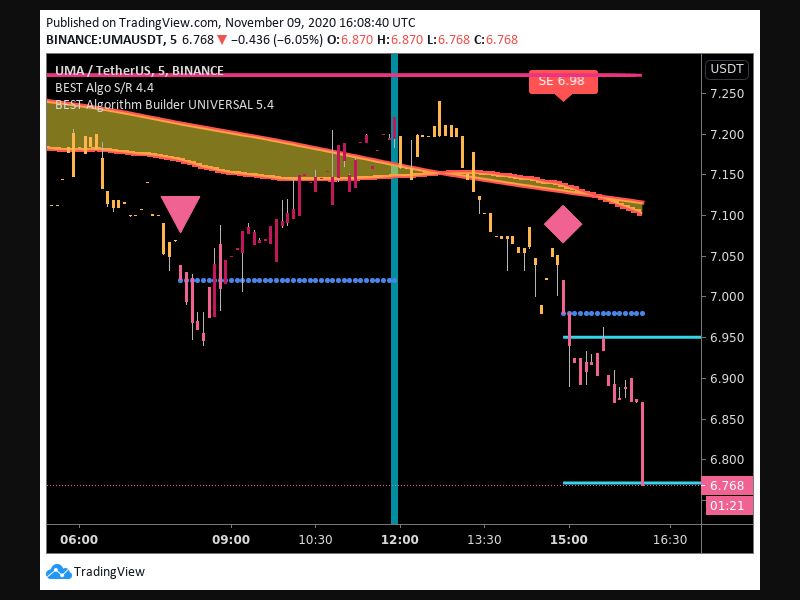
BINANCE:UMAUSDT