Introduction
We humans are simple creatures.
We like to boil down complex situations into a single number.
For example, the economy is complex. So we reduce it to one number -- GDP.
Valuing a company is complex. So we reduce it to one number -- a P/E ratio.
And so on.
Deep-dive into the "Averages" concept
Averages are the same way.
Studying a population is complex. So we tend to look for one number that can represent the whole population.
This number -- more often than not -- ends up being the population's "average".
In general, averages are pretty useful. In many cases, they represent the underlying population reasonably well.
But in one *important* case, they fail. This is when the population has significant outliers.
Outliers can skew averages so much that they become meaningless.
In a nutshell, the problem is this:
When Warren Buffett walks into a McDonald's, the *average* diner there becomes a billionaire.
It's simple math: Buffett is worth ~$80B. If he joins 9 diners who are each worth ~$50K, the *average* net worth of the group is now ~$8B.
But of course, this is absurd.
9 out of those 10 diners will probably never see anything like $8B in their lifetimes.
What happened is that a single outlier -- Buffett -- skewed the group's average so much that the average itself became meaningless.
In life, there are outliers everywhere.
A small part of the population often significantly skews the average of the whole.
The richest people skew the average net worth.
The biggest companies skew the average market cap.
Ultra luxury homes skew the average home price.
One way to avoid this kind of skewing is to use the *median* instead of the average.
Unlike the average, the median doesn't sum up the population.
Instead, it *sorts* the population and *picks the middle* of the pack.
This way, the outliers -- who, by definition, are at the extreme ends of the pack, not in the middle -- don't have much of an impact.
So, even if Buffett walks into a McDonald's, he won't be able to single-handedly skew the median net worth of the diners:
When analyzing businesses as potential investments, it's always a good idea to keep an eye out for outliers skewing averages.
Do a few large customers skew ARPU (Average Revenue Per User)?
Do a few highly profitable stores skew the average profit margin of the whole chain?
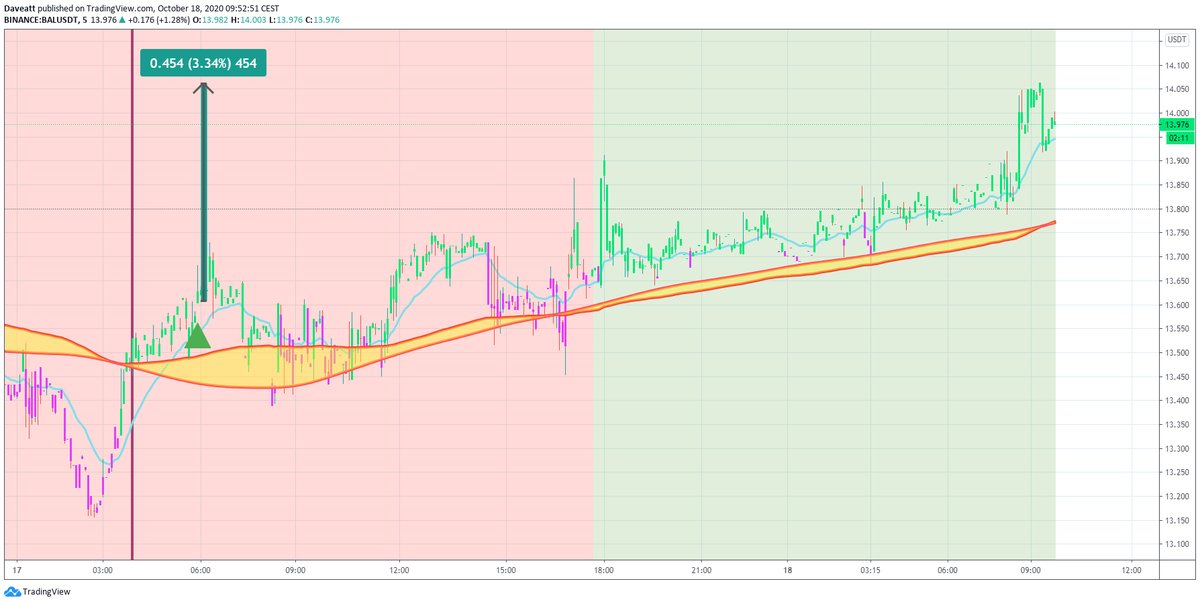
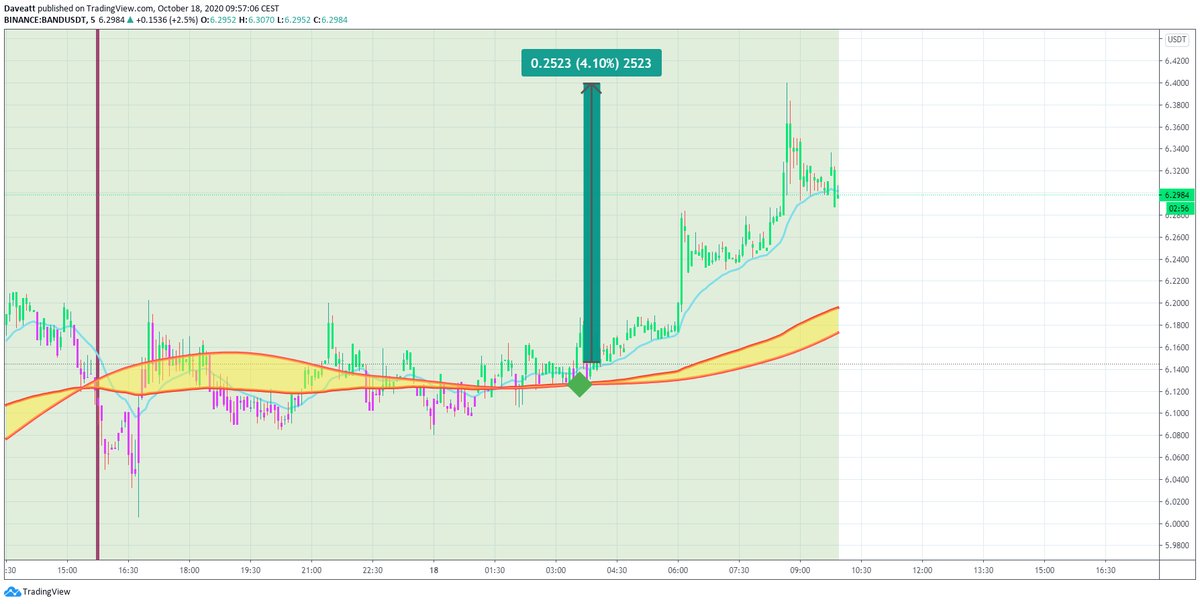
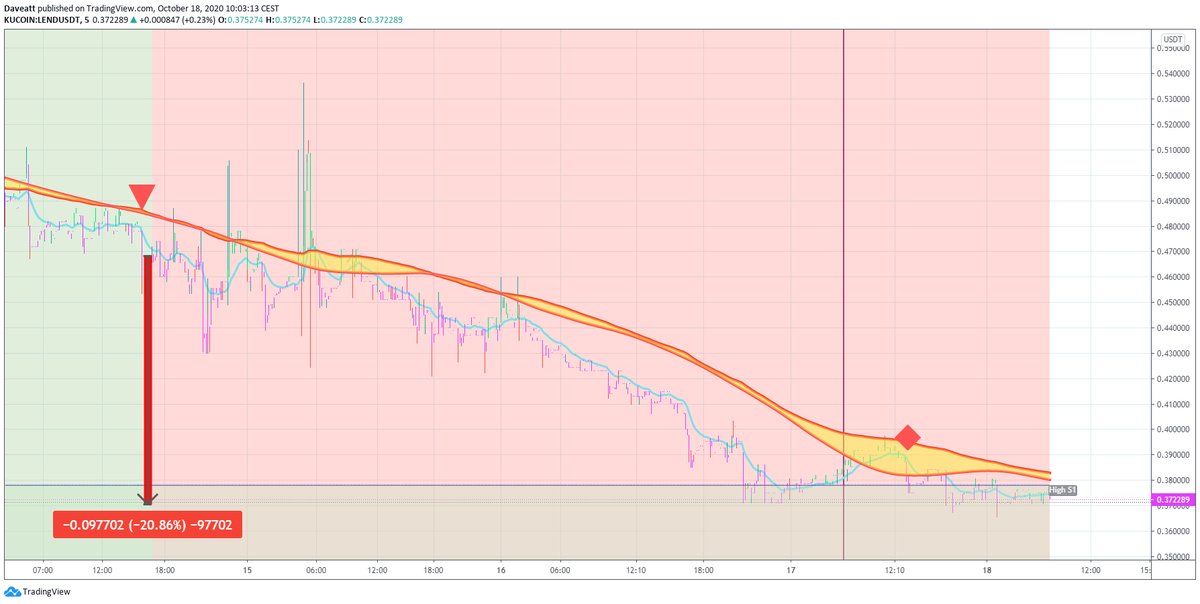
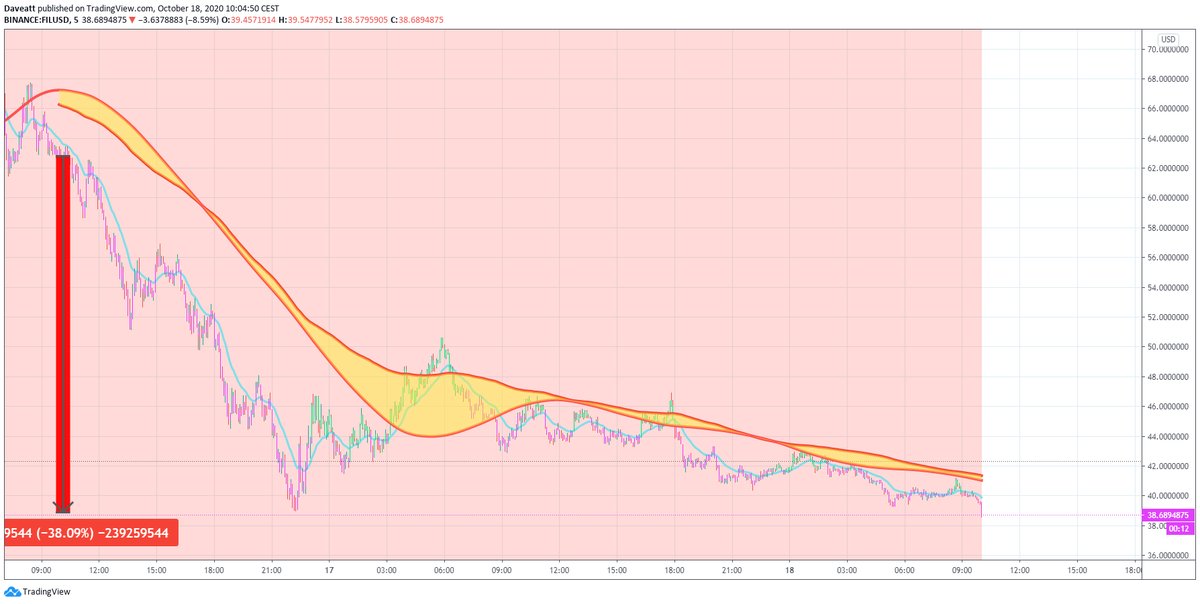
Do a few trades profit/losses skew the the average return per trade?
When making investment/trading decisions, understanding the *worst case downside* is often far more important than understanding the *average case upside*.
Yet, most financial projections seem to be built around average case (and sometimes, better than average case) assumptions.
Let's say there's a 10% chance that A's stock will go to 0 in the next 10 years, but a 90% chance that it will do very well (become a 5-bagger or 10-bagger).
And we have another B's stock with a 50% chance to go to 0 but 50% chance to become a 1000-X bagger.
As Charlie Munger is fond of saying: "All I want to know is where I'll die, so I'll never go there."
Going all in on stock A or B type situations is how investors die -- by taking excessive risk with a big portion of their capital.
As you can imagine, going all-in into B is even more risky even though the reward is infintively bigger.
Conclusion
Averages suffer from all kinds of problems.
Potential workarounds include: medians, worst case scenarios, Kelly-inspired strategies, and utility theory/weighted average
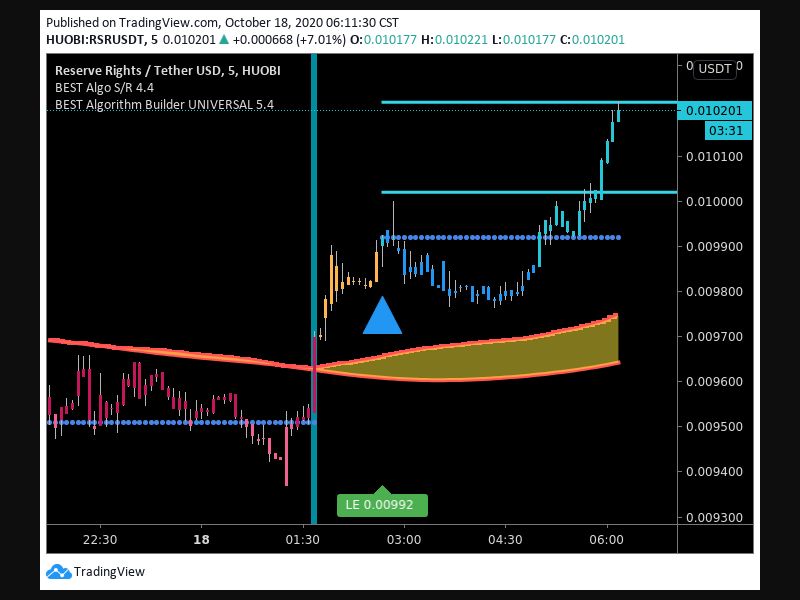
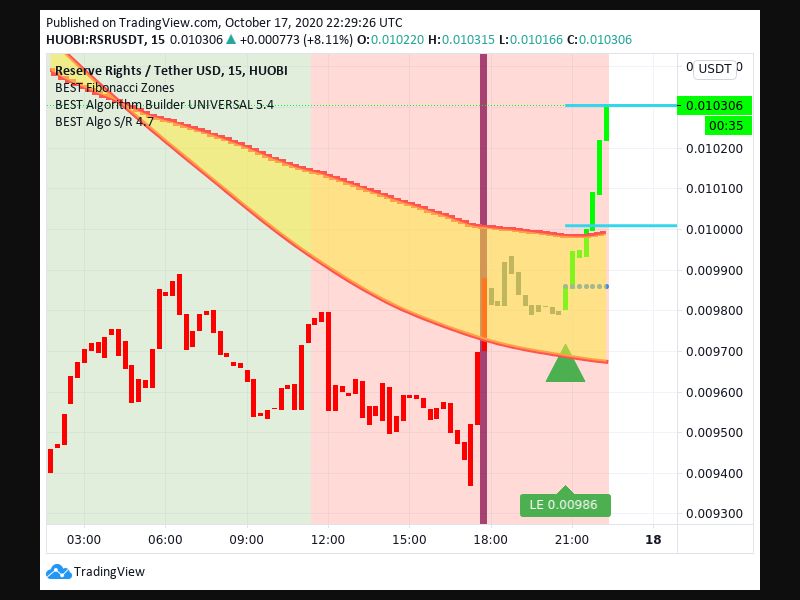
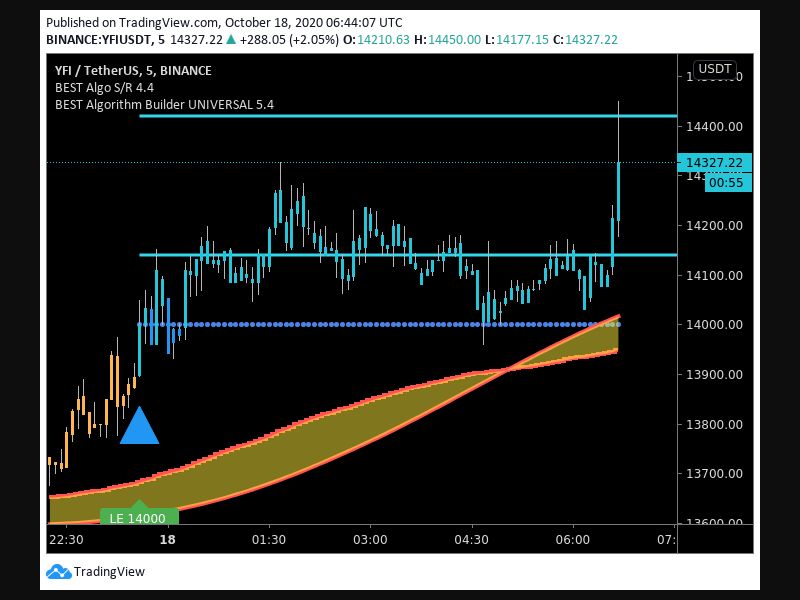
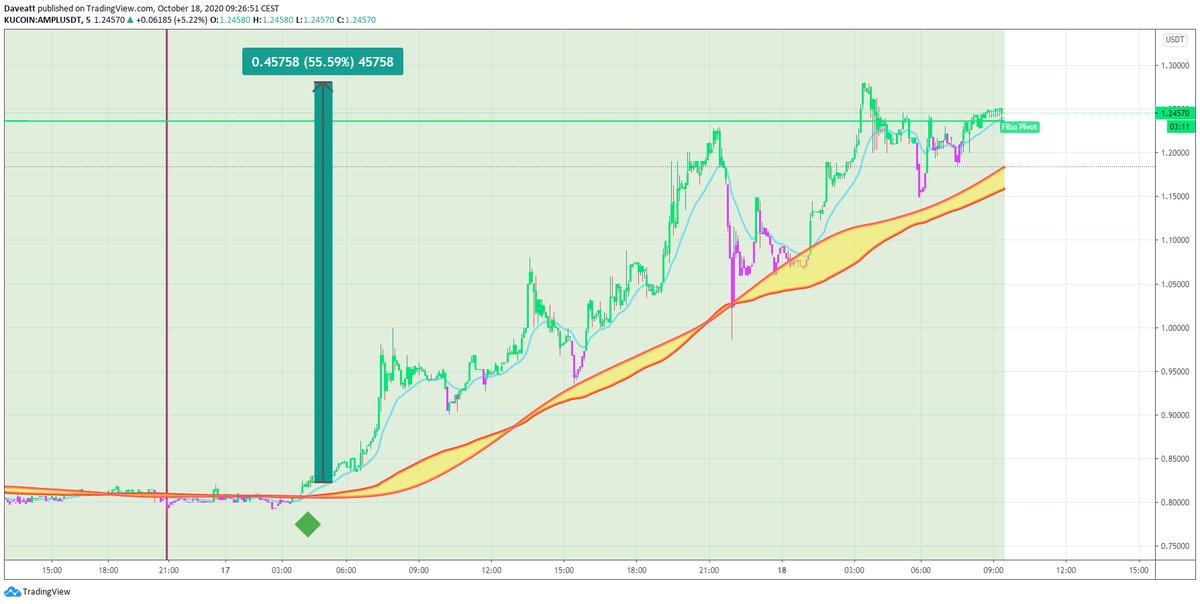
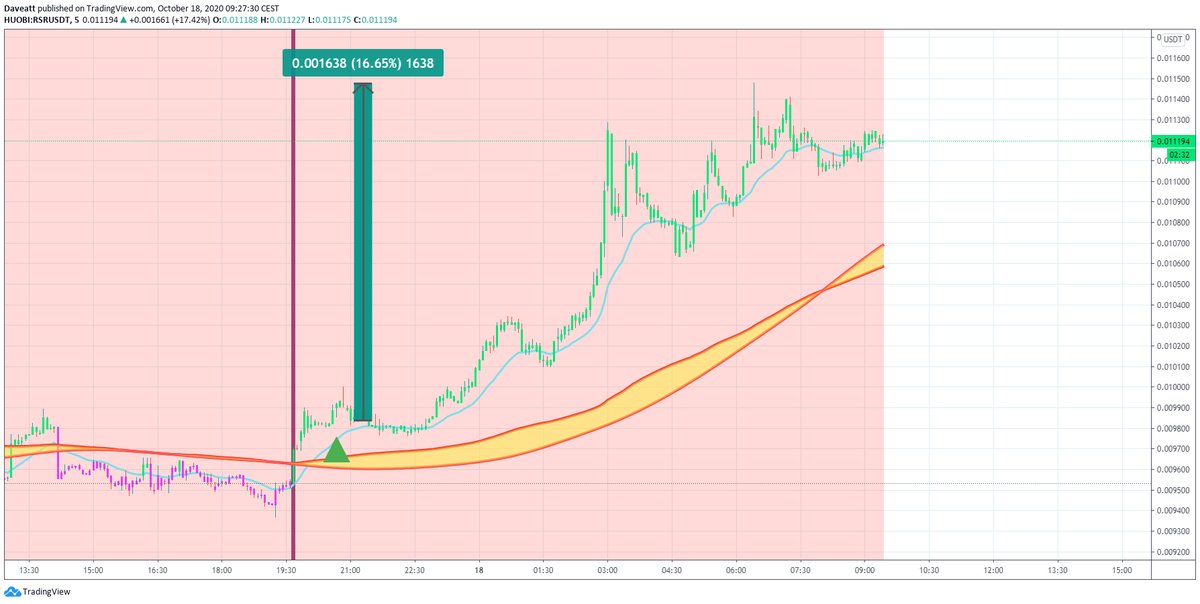
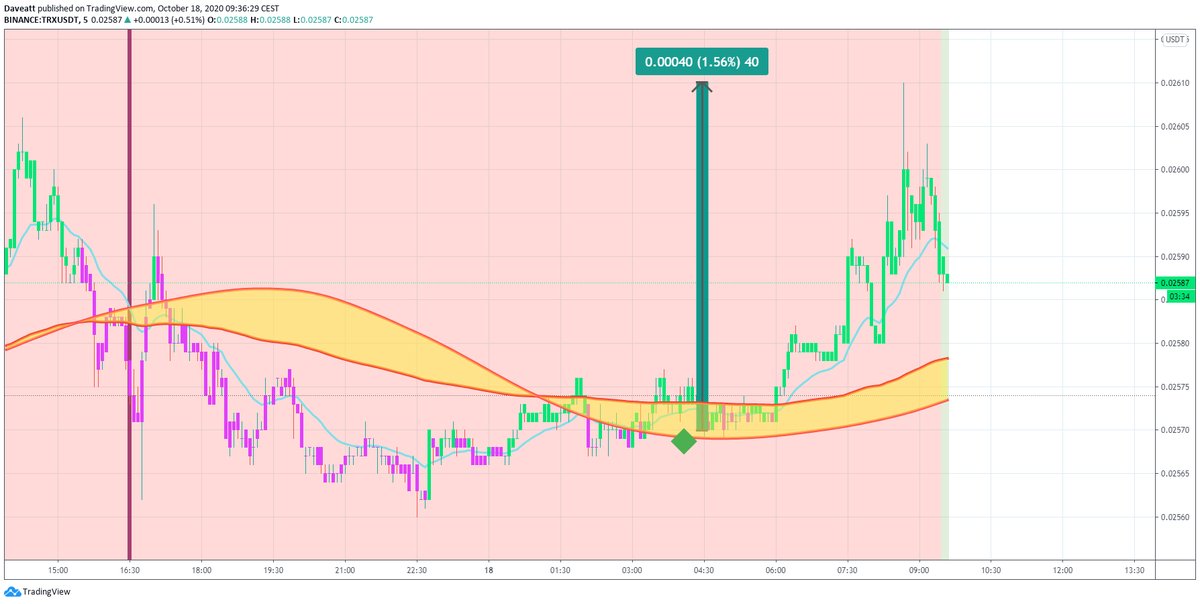
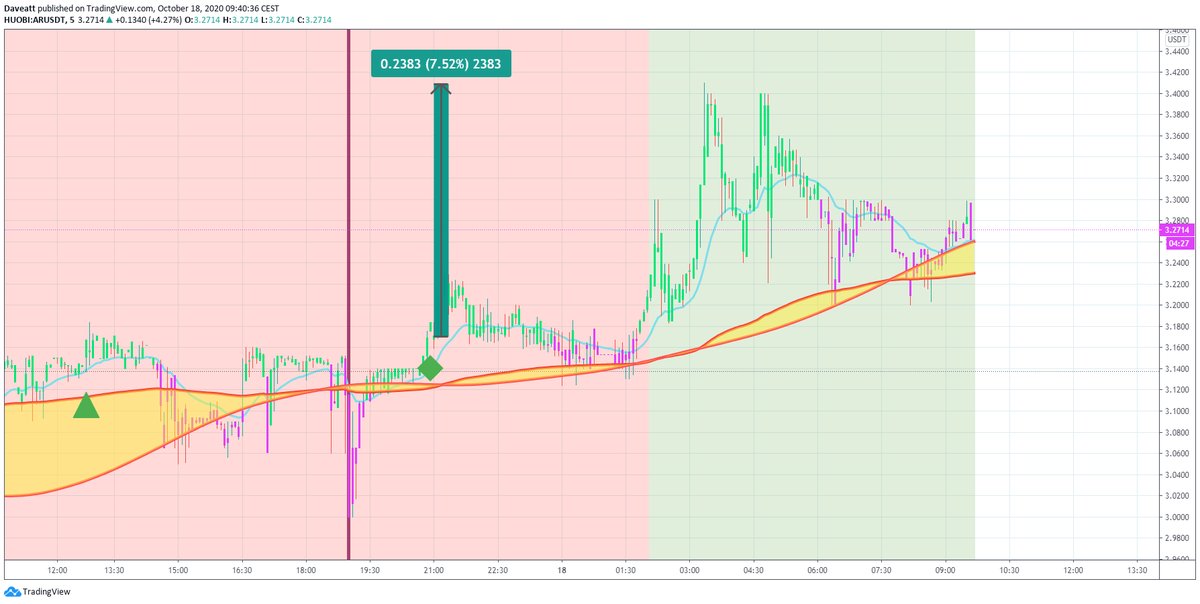
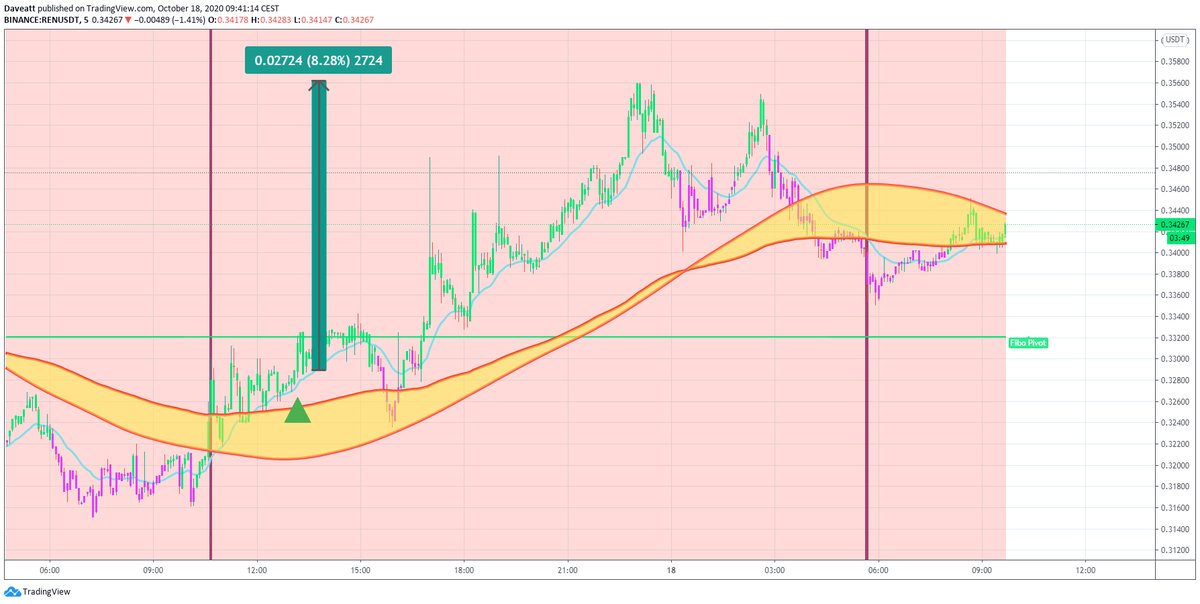
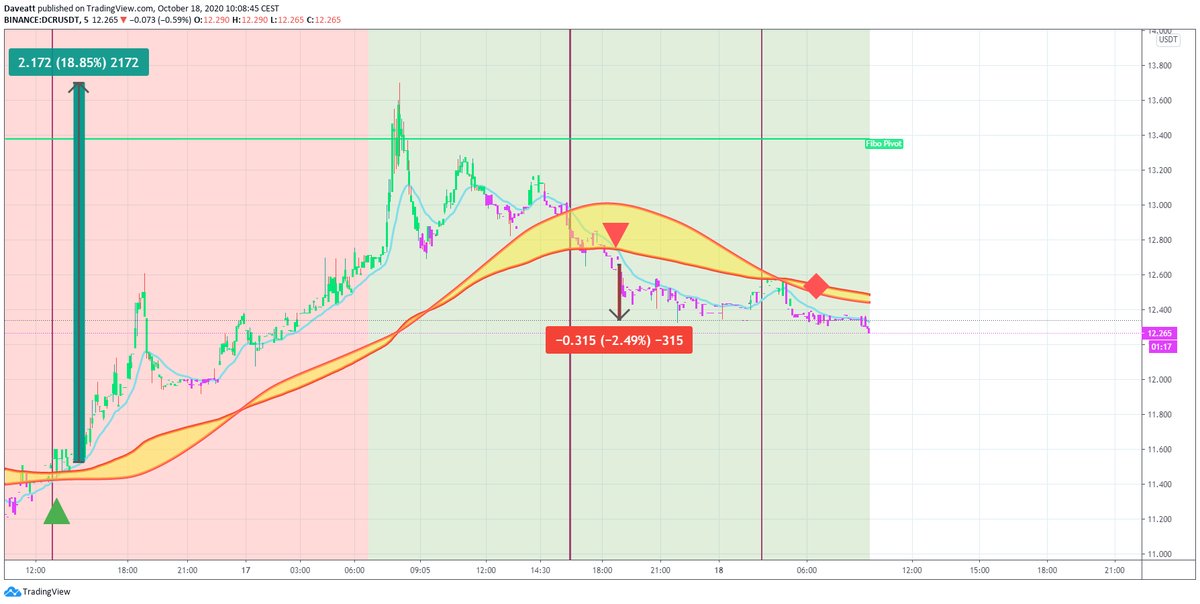
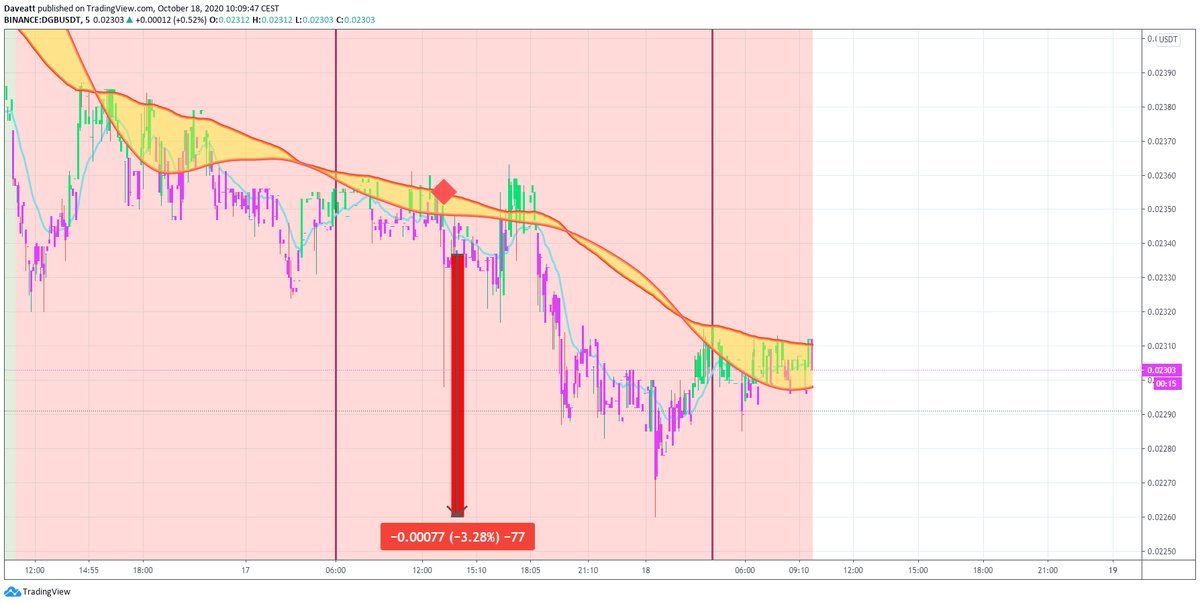
Even better than this, BTI (Best Trading Indicator) uses algorithmic supports and resistances, algorithmic stop-loss to remove the subjectivity and make systemic decisions based on technical indicators only.
This is a solid and proven way of removing of working around the pitfall of averages when designing a trading system.
A quick note
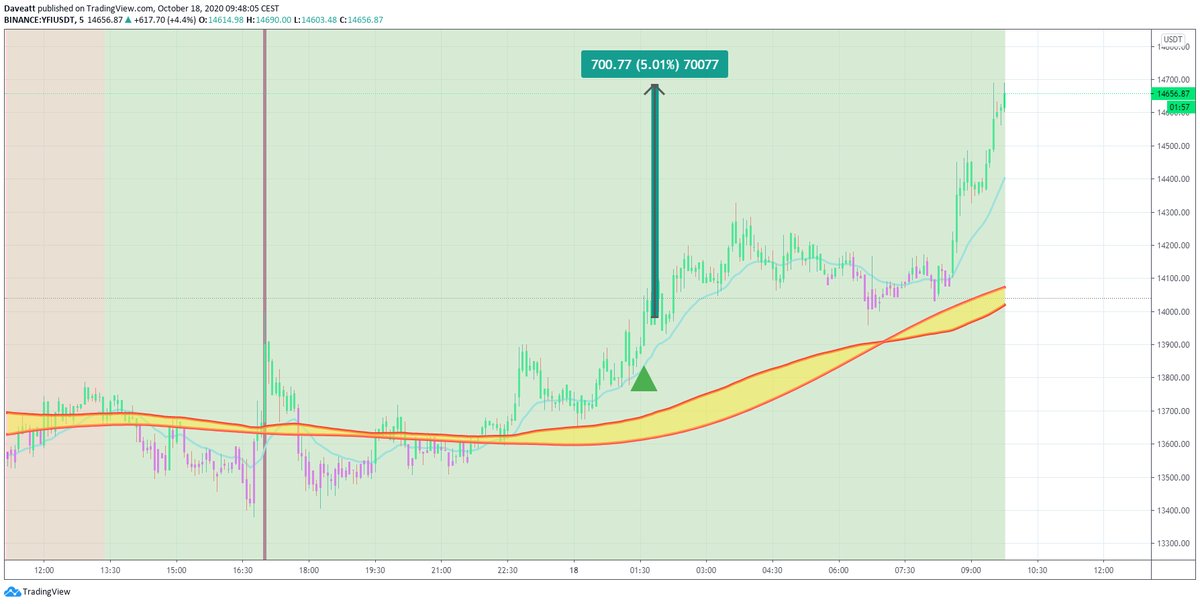
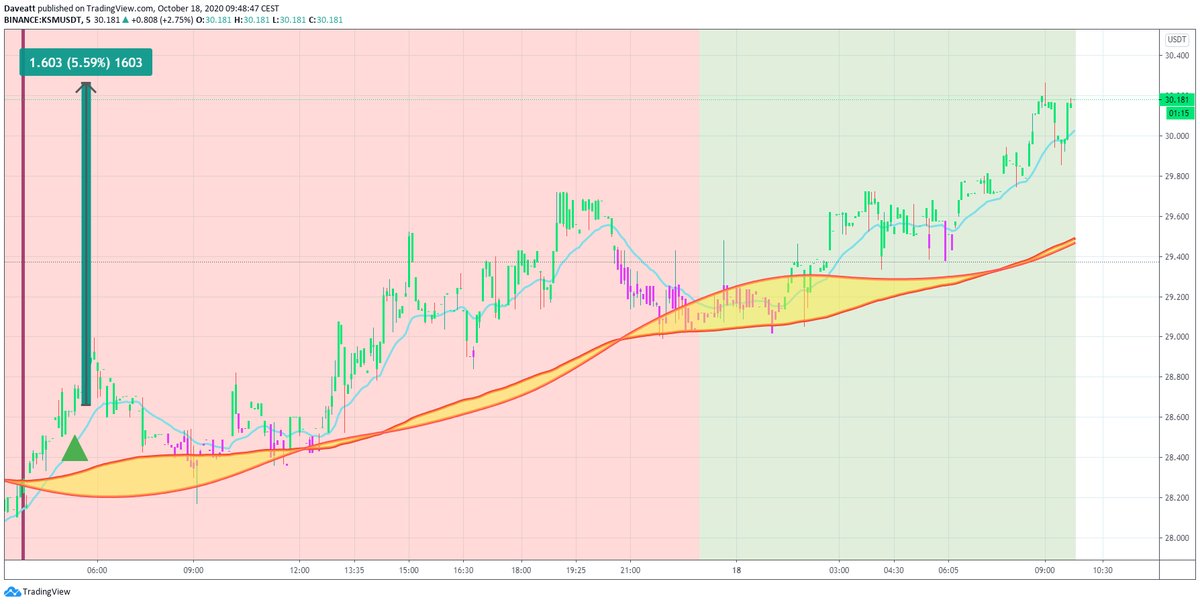
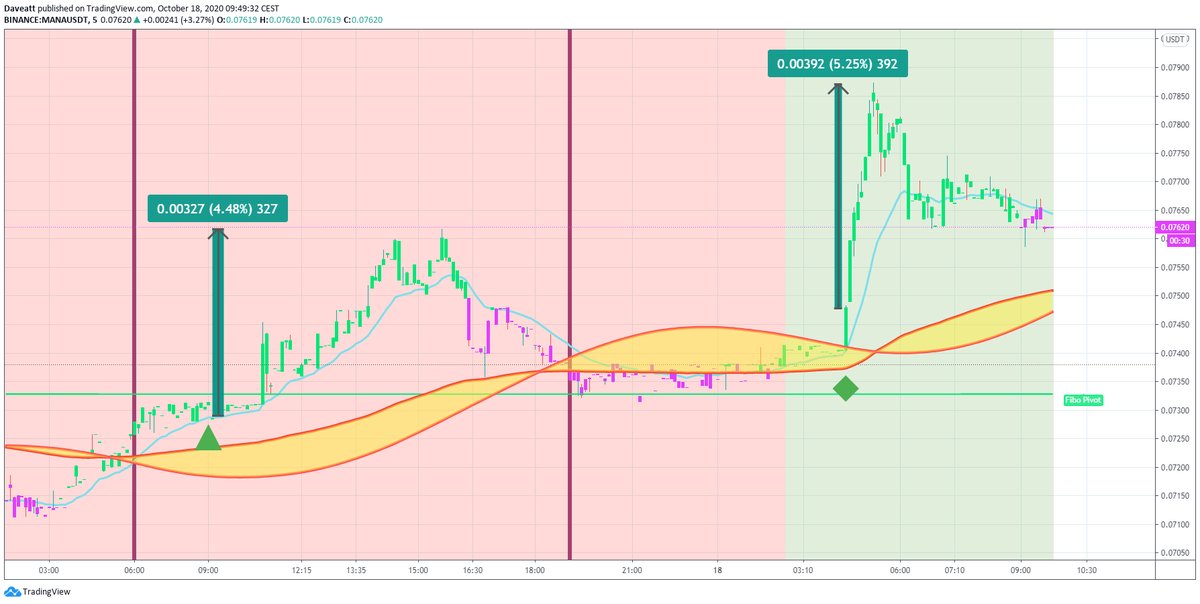
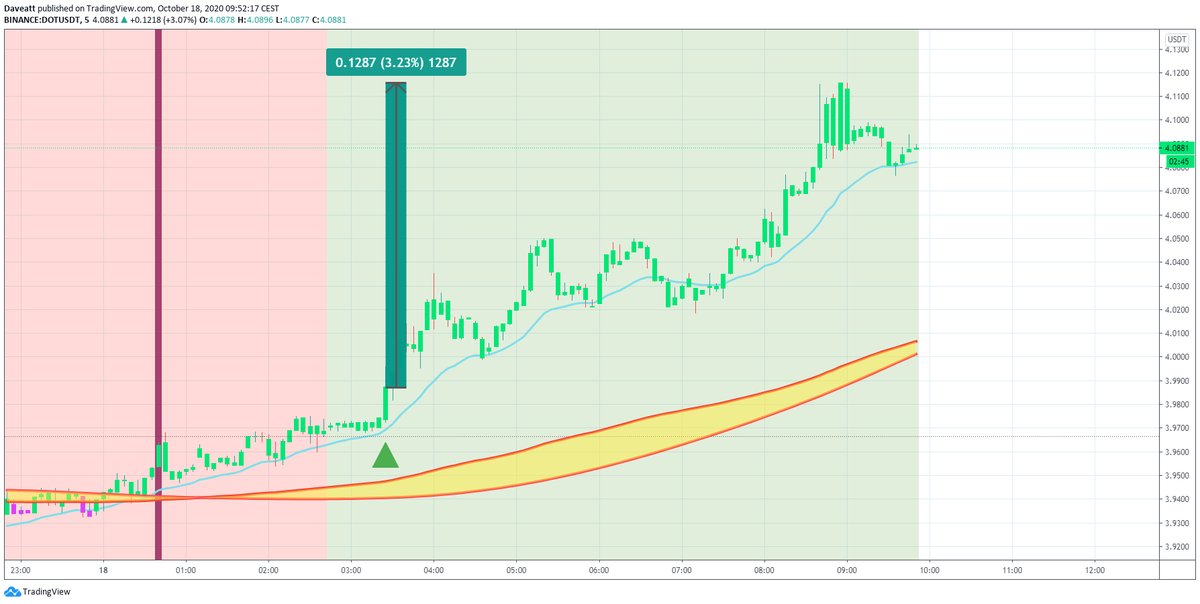
Each screenshot below is clickable and can be enlarged for better visibility


