Welcome
Congratulations on joining our community and trying a systemic way of trading
In this article, I'll try to summarize how you should trade during your first weeks with us
Set your SMART goals
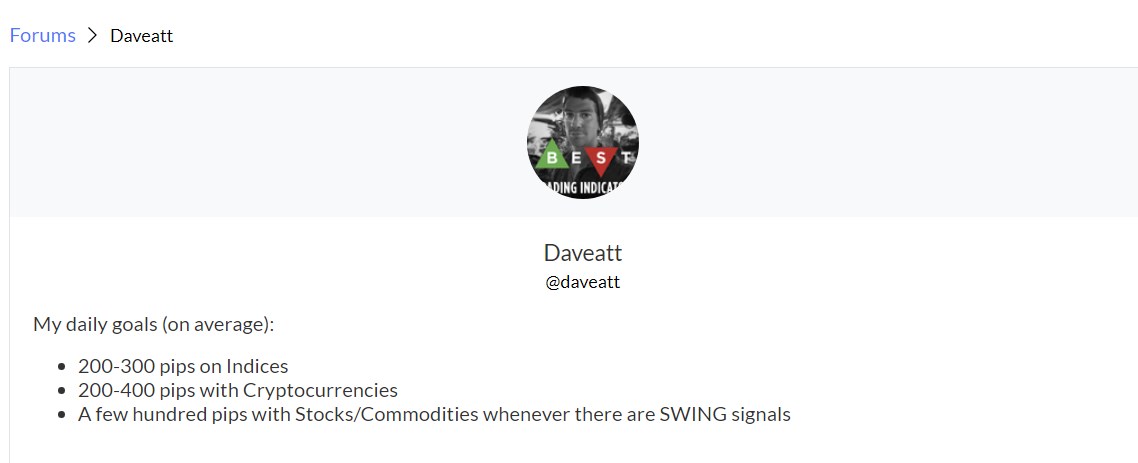
- I want you to edit your description from your profile and to write down your goals
This allows avoiding a lot of losing days due to:
- extreme greed and overtrading
- extreme stupidity and losing because without a proper goal, how do we know when to stop for the day?
- and becoming accountable to yourself and the community for based on signals and not based on how you feel
I wrote mine this way.
💎 I'll keep mentioning trading goals in the Trading method tutorials.
I'll refer to yours whenever you'll ask me questions about the method.
Most traders lose because they trade blind, without goals, based on feelings.
💎 Please help me to help you by setting SMART goals on your profile description.
Subscribe to the forum
Subscribing is strongly recommended as I make all the updates and announcements there.
Check Enable Notifications
The subscribers get updated by emailSubscribe to at least those 4 (but we recommend subscribing to all forums)
1) Official announcements
2) Method
3) Method Q&A
4) Frequently Asked Questions
Click on the green SAVE button
Please don't forget to check your SPAM folder sporadically at least once a week :)
We have a good reputation with most of the main email providers now.
But sometimes, the forum email notification ends up in the SPAM folder.
Understanding our signals
There is a primary trend symbolized by the triangle, and within that primary trend, there is a secondary trend in the same direction symbolized by the diamonds.
We're using a different system for both the primary and secondary trends.
We use a system based on convergence for both to detect whether the used indicators are pointing in the same direction or not.
If they're all converging, then we display the signal.
It's basically a mix of momentum indicator + strength + a few other indicators we invented years ago for ourselves,
Paper trading
This goes without saying, but when testing a new trading method, it's imperative to demo trade for at least a few days.
A few weeks if you have never traded with real money for at least a few months
You won't lose any time/money doing this; that's quite the opposite.
It will save you a lot of time and potential drawdown to ensure you understand how to use our signals and learn more about yourself.
To make sure you understand the method 100%.
We're confident you can see how profitable it is after a few minutes of visual backtesting your TradingView charts with our indicators.
Supports and Resistances
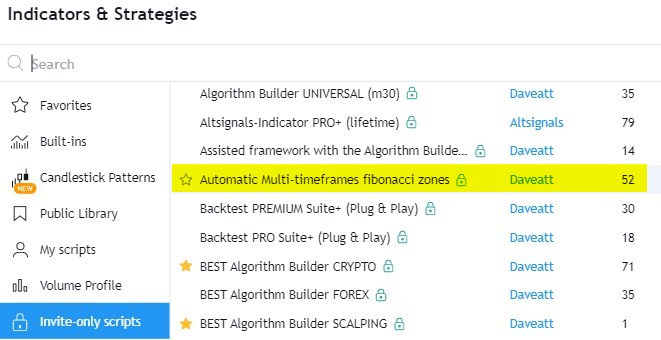
💎 Add the script below to your chart
Script name to look for from your Invite-only scripts: [All-In-One] Algorithmic Supports and Resistances
💎Contains the Take Profit and Safeguards zones required for our you to make money and to know when to wait for a pullback
Fibonacci Zones
💎 With our Trading Method, we use the Automatic Multi-timeframes Fibonacci zones
We consider them as strong support and resistance zones.
This script will be in your Invite-Only TradingView script under the Automatic Multi-timeframes Fibonacci Zones name.
Included Trade Manager and Standalone Trade Manager scripts
💎 Read twice what I'm going to say, guys
You won't need them for your first weeks/months with us.
YES!! You'll only:
1) use the supports/resistances to set your take profit levels manually
2) use the hard exit as a hard stop-loss
3) use a soft stop-loss at breakeven + spreads to protect your position once it moves in your favor (or before hitting the next support or resistance)
For 3), you may use the embedded Trade Manager in your Algorithm Builder, setting your stop-loss level using the Fixed Price Value option.
Pullback
Sometimes we can enter at market (with the Best High Reward trades) as the setup is either extremely bullish or bearish.
However, when facing support(s)/resistance(s), we might need to aim for a pullback near the black EMA.
A pullback is a hedge against massive drawdown and stress out.
Learn more here
Position Size
Those are not set in stones
rules.
It's only to give you an idea of how to estimate your position size before entering a trade.
Let's say your usual position size is X USD/pips.
As a rule of thumb, if there is any risk (against leading or facing S/Rs or black EMA not correctly positioned vs the cloud ..), I'll wait for a pullback + go with a position size such as X/2.
If I identify two risks (against leading trend AND facing S/Rs), I'll wait for a deeper pullback + go with a position size such as X/3.
If I identify three risks (against leading trend AND facing S/Rs AND black EMA not correctly positioned versus the cloud), I'll wait for a deeper pullback + go with a position size such as X/4.
For a super high reward trade (with the leading trend, EMA correctly positioned vs the cloud, no S/Rs near), I could even go with a 2X or even 3X position size as those trades are very low risk and potentially high rewarding.
VIX and DXY
This chapter is valid for all asset classes
June 29th, 2021 Edit: DXY seems to have NO impact on BTC and crypto assets
I tend now to disregard it for trading cryptocurrencies. completely
The VIX (Volatility Index) is also called the FEAR
index.
- the lower, the more greedy traders are: bullish signal
- the higher, the more scared they are: bearish signal
The DXY (Dollar Index) is a basket of currencies expressed against the Dollar.
- if trending down, it means the Dollar is getting weaker (mostly due to money printing)
- if trending up, it means the Dollar is getting stronger (mostly due to counter currencies being stronger or dropping less than the Dollar)
As a rule of thumbs:
If VIX < 30, we can pretty much ignore VIX and focus on DXY for a bearish/bullish bias.
If VIX > 30, then there is always a bearish bias. If DXY is trending up, the bias is even more bearish.
Please note, this doesn't mean I won't take either longs/shorts only
I'd just be more cautious when counter-trading the DXY and look at deeper pullbacks.
Cryptocurrencies
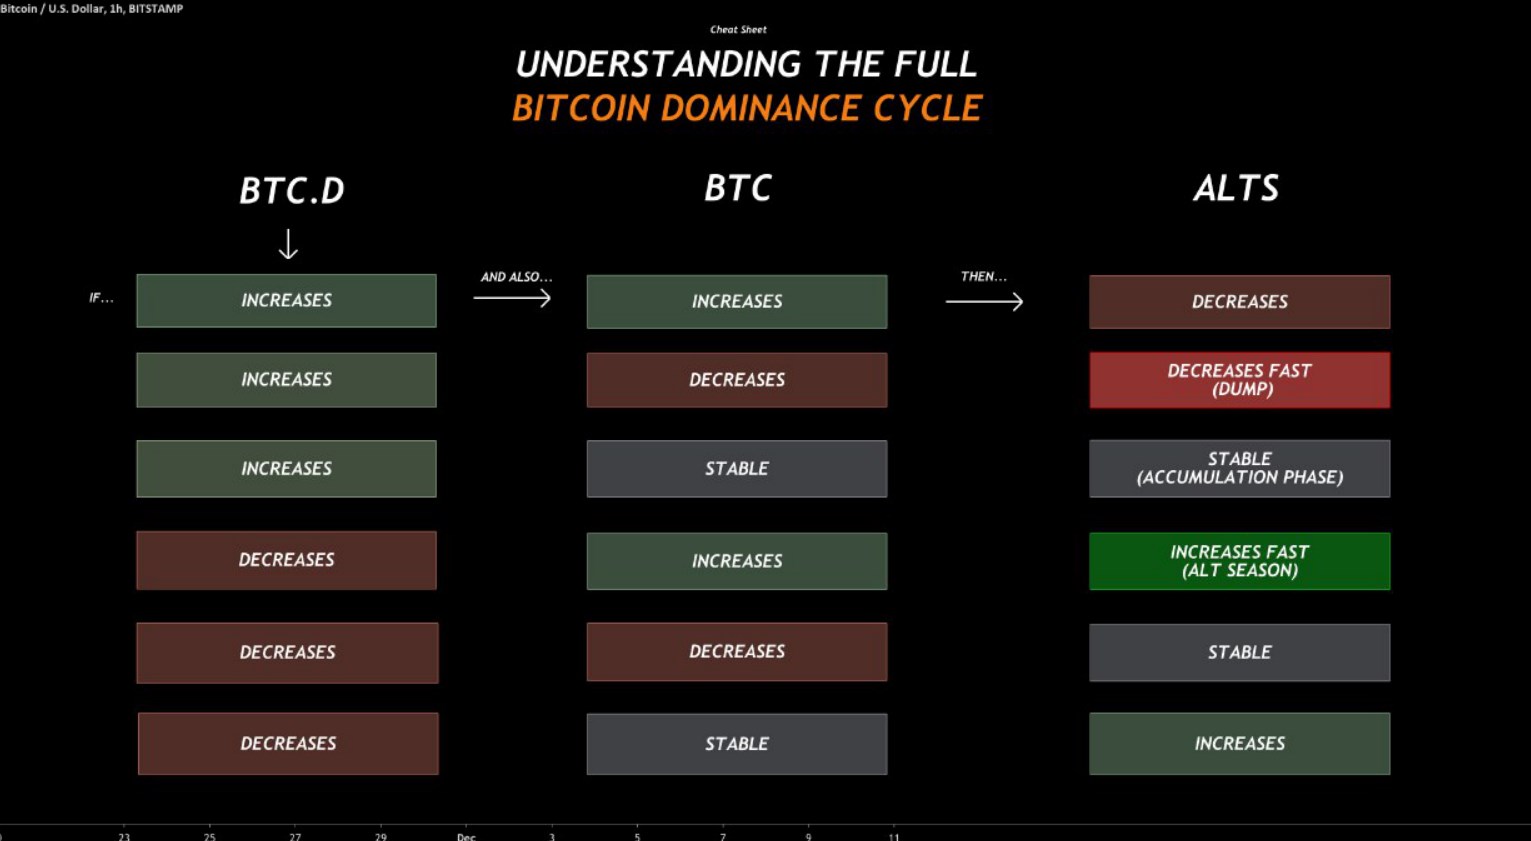
There are times to trade ALTS and times to trade BTC.
In summary:
when BTC shows some momentum (either way up or down), stay away from ALTS
when BTC ranges intraday, that's when it's smarter to jump into ALTS
More information is available in this short guide
Predicted funding
After a huge momentum, either way, the predicted funding tends to be high
It's considered high when above 0.1%
You can visualize it from this website: https://www.bybt.com/FundingRate.

After a strong move, we need to clean the overleveraged traders before going further.
That's how markets work - we kill the greedy ones without risk management.
Pre-select the right assets for the right timeframes
It's very possible that for some assets (low-caps altcoins, exotic FX pairs, some stocks, ...) some timeframes won't work well.
We haven't tested them all, and there are many more cryptos/stocks/forex pairs we haven't tested than we tested (obviously)
That's why we recommend visually backtesting any asset before trading a pair in a given timeframe.
Very likely, an asset on a given timeframe giving bad/average/late signals would be better on a different timeframe.
Usually, it's erratic like this when the traded volume is super low.
So they’re not interested in trading in the first place anyway.
Video
We summarized all of the content below in this live Q&A YouTube video.
https://www.youtube.com/watch?v=ufaYXx3DUTM
Combine the timeframes
It's a great practice to select a signal in a bigger timeframe and take all the trades with a smaller timeframe in the same direction.
Example:
I could see that my H1 BTC/USDT trend is bullish, so I could decide only to take the m5/m15 longs, for example, as they're more likely to reward me.
The timeframes I selected for this example don't matter at all.
As an intraday trader, I really like the combo of using the m15 trend as my swing trend and getting in using the m5 and/or m2 timeframes.
Triangles and Diamonds
Only the triangle/diamond signals are entry points
Following this announcement from January 2021: https://best-trading-indicator.com/community/bti/forums/3866-official-announcements/topics/22254-version-6-3#important-notes
With the pullback METHOD, whenever required, you'll be protected.
Trading Method 101
Even though you received our PDF by email, we strongly recommend reading our content on the website forum.
They give more concrete examples and details.
We compiled the most important articles using the #ramp-up tag.
Trading Method tutorials: https://best-trading-indicator.com/community/bti/tags?query=ramp-up
Screeners
Your preferred assets might not always be trending up or down (they could range too and for an extended period of time)
That's why I select every morning the hyped
assets from our favorite screeners and then I create the alerts for some of those hyped
assets
Bi-weekly Live Q&A
We organize recorded bi-weekly Q&A on Zoom - we advise everyone a few days before on Discord in the #vip-lobby channel.
The previous sessions are recorded here