Welcome to the BEST forum for traders

Did you know we're sharing tons of exclusive content here?
Our community is growing quickly. Take a look around and say "Hello".

RSI Background Color Appearing as Vertical Lines

Aug 22, 2021 - 6:05 PM

Viewed 1299 times

https://best-trading-indicator.com/community/bti/forums/4180/topics/25653 COPY
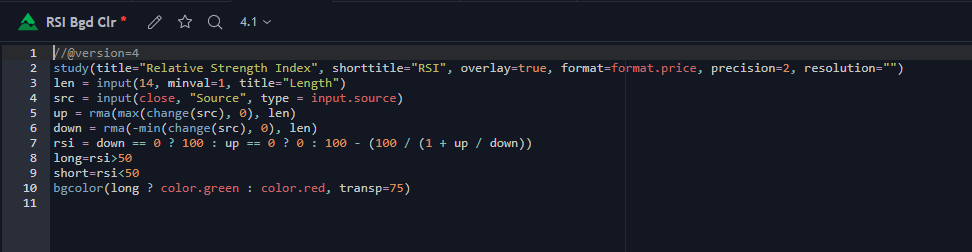
  • I've altered the built-in RSI code to add a background of green when above the 50 midpoint, and add a background of red when below the 50 midpoint (background is overlay-ed on the chart, not in a pane).

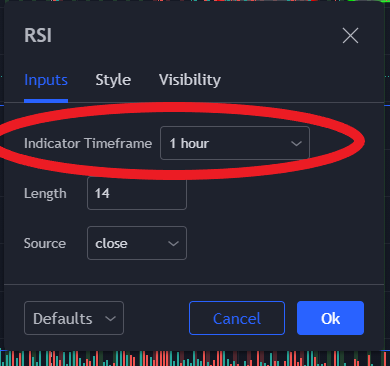
    Additionally, I've set the indicator to the 1 hour time frame, rather than same as chart 
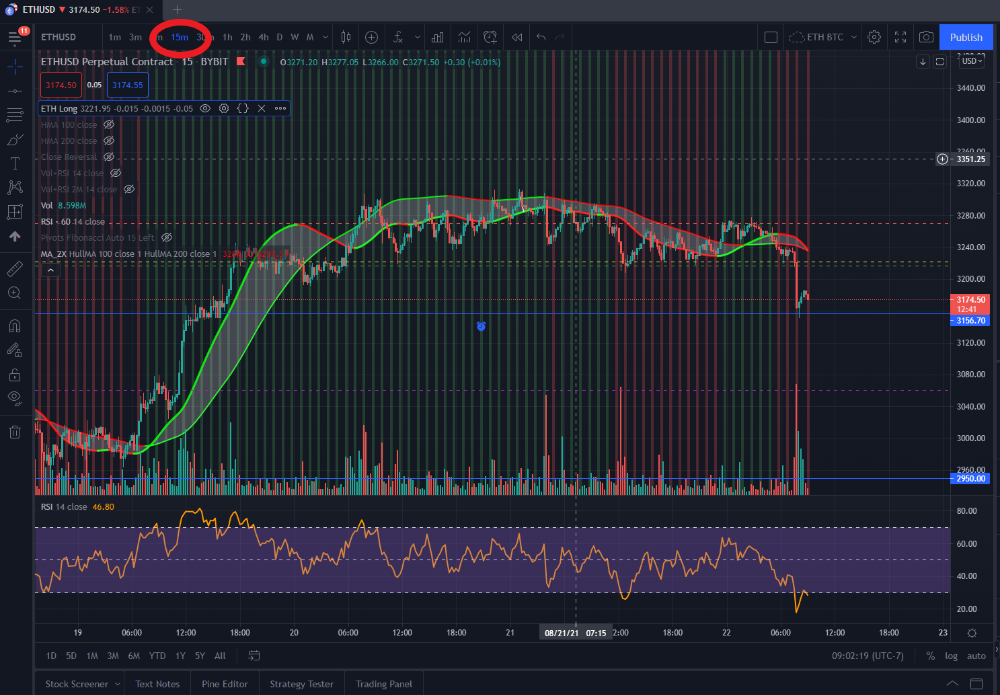
. However, when I'm viewing time frames shorter than 1 hour, the background appears as vertical lines, rather than a solid background.

    Is it possible to have the background appear as one solid color in this case?

    CODE

    //@version=4
    study(title=Relative Strength Index, shorttitle=RSI, overlay=true, format=format.price, precision=2, resolution=")
    len = input(14, minval=1, title=
    Length)
    src = input(close,
    Source", type = input.source)
    up = rma(max(change(src), 0), len)
    down = rma(-min(change(src), 0), len)
    rsi = down == 0 ? 100 : up == 0 ? 0 : 100 - (100 / (1 + up / down))
    long=rsi>50
    short=rsi<50
    bgcolor(long ? color.green : color.red, transp=75)

    Code.png

    RSI Settings.png

    Chart.png

    0
  • Hello trader

    If you mean to set your indicator on hourly on a lower timeframe chart, this isn't possible.
    TradingView displays (at best) unexpected results when we use a multi-timeframe indicator on a lower chart timeframe

    The contrary is possible though i.e. a multi-timeframe indicator with a timeframe greater than the chart timeframe.

    0
  • Hi Dave,
    Thanks for the response. I thought that might be the case, unfortunately. I appreciate your insight.

    0
CONTENTS