Diagram
Explanations
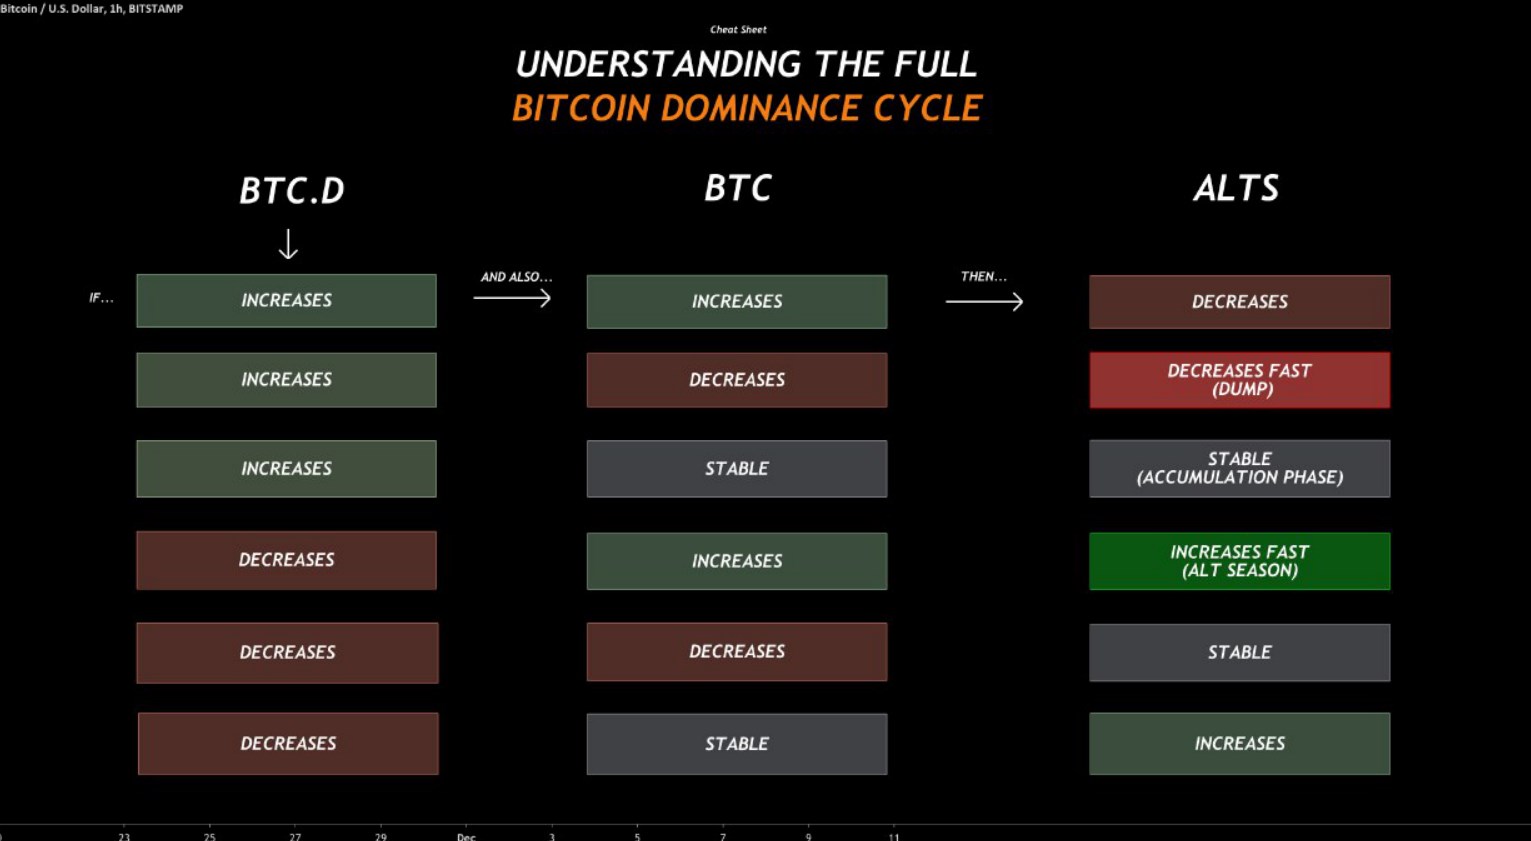
Here I will be showing a simple diagram of the whole Bitcoin dominance effect towards Bitcoin and Altcoins.
The diagram is extremely simplified so that anyone can refer to this chart in the future.
Many people have a hard time when an alt season starts; however, understanding the few simple rules of Bitcoin dominance can help you know whether you are in a bull market or not!
In the above diagram, I am showing the complete relationship between BTC Dominance ( BTC .D), Bitcoin's price, and Altcoin's price.
You can refer to the image above and use it to your advantage on positioning, timing, and risk management without the whole FOMO (Fear Of Missing Out) ordeal.
So, what is Bitcoin Dominance ( BTC .D on TradingView)?
Bitcoin dominance is the percentage that measures Bitcoin’s share of the WHOLE cryptocurrency market capitalization measured in percentages.
It is not a 100% perfect metric to use, but it helps to analyze the macro-market since many people like to refer to it - so it becomes a self-fulfilling prophecy, and a self-fulfilling prophecy is what usually happens if everyone starts to use it.
We can observe the total capital (money) flowing between alts and BTC with this chart and make some conclusions about the market’s current state.
The diagram above is showing that in most cases you’ll want to be in Bitcoin when Bitcoin Dominance is in an uptrend, and then be in alts when the Bitcoin Dominance is in a downtrend.
When BTC and BTC .D rises, we psychologically assume that we want to be in Bitcoin, which then leads to a decrease in the altcoin market.
For those who are interested in more risk management strategies, please look at the links below!