Tutorial video
https://www.youtube.com/watch?v=YsI23WORsBM
Nassim Nicholas Taleb's quote
The retrospective distortion, or how we can assess matters only after the fact, as if they were in a rearview mirror (history seems clearer and more organized in history books than in empirical reality).
In other words, what happened in the past always look easy when analyzed afterwards
Who is it available to?
🔸 Available to the VIP 12 months subscribers and Standalone TradingView one-time-payment buyers only
Do you need to backtest our Algorithm builders?
🔸 Rest assured we're constantly backtesting, forwardtesting our frameworks on a daily basis to optimize them
🔸 Our take-profit method is based on that leading trend background and those supports and resistances
They're dynamic and this is not something that can be implemented in a backtest because, we're aiming for zones when taking profit
🔸Talking about zones once more, we also aim for zones when entering on pullback whenever it's required.
Another reason, to not use the backtester on our frameworks to draw conclusions regarding their effectiveness.
Recommendations
Assuming you're using it on your own indicators and not with the Algorithm Builders
🔸 Stick to higher timeframes.
On progressively lower timeframes, margins decrease and fees and slippage take a proportionally larger portion of profits, to the point where they can very easily turn a profitable strategy into a losing one.
Additionally, your margin for error shrinks as the equilibrium of your system’s profitability becomes more fragile with the tight numbers involved in the shorter time frames. Avoid <1H time frames.
🔸 Know and calculate fees and slippage.
To avoid market shock, backtest using conservative fees and slippage parameters.
Systems rarely show unexpectedly good returns when they are confronted to the markets, so put all chances on your side by being outrageously conservative—or a the very least, realistic.
Test results that do not include fees and slippage are worthless.
Slippage is there for a reason, and that’s because our interventions in the market change the market. It is easier to find alpha in illiquid markets such as cryptos because not many large players participate in them.
If your backtesting results are based on moving large positions and you don’t also add the inevitable slippage that will occur when you enter/exit thin markets, your backtesting will produce unrealistic results.
Even if you do include large slippage in your settings, the Engine can only do so much as it will not let slippage push fills past the high or low of the entry bar, but the gap may be much larger in illiquid markets.
🔸 Never test and optimize your system on the same dataset, as that is the perfect recipe for overfitting or data dredging, which is trying to find one precise set of rules/parameters that works only on one dataset.
These setups are the most fragile and often get destroyed when they meet the real world.
🔸 Try to find datasets yielding more than 100 trades.
Less than that and results are not as reliable.
🔸 Consider all backtesting results with suspicion.
If you never entertained skeptic tendencies, now is the time to begin.
If your backtest results look really good, assume they are flawed, either because of your methodology, the data you’re using or the software doing the testing.
Always assume the worse and learn proper backtesting techniques such as monte carlo simulations and walk forward analysis to avoid the traps and biases that unchecked greed will set for you.
If you are not familiar with concepts such as survivor bias, lookahead bias and confirmation bias, learn about them.
🔸 Stick to simple bars or candles when designing systems.
Other types of bars often do not yield reliable results, whether by design (Heikin Ashi) or because of the way they are implemented on TV (Renko bars).
🔸 Know that you don’t know and use that knowledge to learn more about systems and how to properly test them, about your biases, and about yourself.
🔸 Manage risk first, then capture opportunity.
🔸 Respect the inherent uncertainty of the future.
Cleanse yourself of the sad arrogance and unchecked greed common to newcomers to trading. Strive for rationality.
Respect the fact that while backtest results may look promising, there is no guarantee they will repeat in the future (there is actually a high probability they won’t!), because the future is fundamentally unknowable.
🔸 Have a plan.
Understand what king of trading system you are trying to build.
Have a clear picture or where entries, exits and other important levels will be in the sort of trade you are trying to create with your system.
This stated direction will help you discard more efficiently many of the inevitably useless ideas that will pop up during system design.
🔸 Be wary of complexity.
Experienced systems engineers understand how rapidly complexity builds when you assemble components together—however simple each one may be.
The more complex your system, the more difficult it will be to manage.
🔸 Plug and Play!
Allow yourself time to play around when you design your systems.
While much comes about from working with a purpose, great ideas sometimes come out of just trying things with no set goal, when you are stuck and don’t know how to move ahead. Have fun!
Metrics
They're listed here
This is a non-exhaustive list and I'm not listing them all on this guide
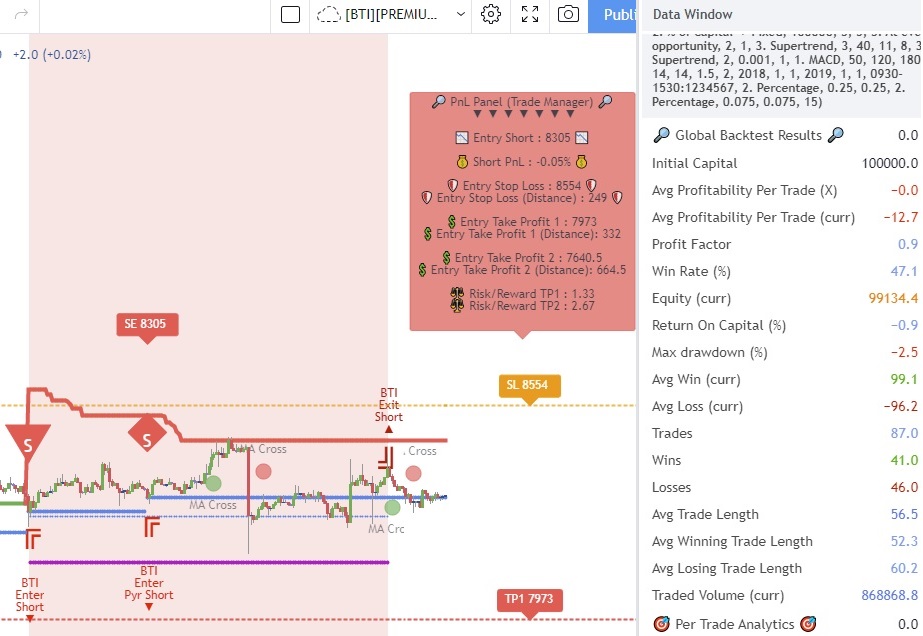
Global Numbers
Numbers in this section represent the results of all trades up to the cursor on the chart.
🔸 Average Profitability Per Trade (RISK): This value is the most important gauge of your strat’s worthiness. It represents the returns that can be expected from your strat for each unit of risk incurred.
E.g.: your APPT is 2.0, thus for every unit of currency you invest in a trade, you can on average expect to obtain 2 after the trade.
APPT is also referred to as “statistical expectancy”.
If it is negative, your strategy is losing, even if your win rate is very good (it means your winning trades aren’t winning enough, or your losing trades lose too much, or both).
Its counterpart in currency is also shown, as is the APPT/bar, which can be a useful gauge in deciding between rivalling systems.
🔸 Profit Factor: Gross of winning trades/Gross of losing trades. Strategy is profitable when >1.
Not as useful as the APPT because it doesn’t take into account the win rate and the average win/loss per trade.
It is calculated from the total winning/losing results of this particular backtest and has less predictive value than the APPT.
A good profit factor together with a poor APPT means you just found a chart where your system outperformed.
Relying too much on the profit factor is a bit like a poker player who would think going all in with two’s against aces is optimal because he just won a hand that way.
🔸 Win Rate: Percentage of winning trades out of all trades.
Taken alone, it doesn’t have much to do with strategy profitability.
You can have a win rate of 99% but if that one trade in 100 ruins you because of poor risk management, 99% doesn’t look so good anymore.
This number speaks more of the system’s profile than its worthiness.
Still, it can be useful to gauge if the system fits your personality.
🔸 Equity (currency): This the sum of initial capital and the P&L of your system’s trades, including fees and slippage.
🔸 Return on Capital is the equivalent of TV’s Net Profit figure, i.e. the variation on your initial capital.
🔸 Maximum drawdown is the maximal drawdown from the highest equity point until the drop . There is also a close to close (meaning it doesn’t take into account in-trade variations) maximum drawdown value commented out in the code.
🔸 PEA: Avg Max Opp . Available (RISK): the average maximal opportunity found in the Post-Exit Analyses.
🔸 PEA: Avg Drawdown to Max Opportunity (RISK): this represents the maximum drawdown (incurred from the close at the beginning of the PEA analysis) required to reach the maximal opportunity point.
Trade Information
Numbers in this section concern only the current trade under the cursor. Most of them are self-explanatory. Use the description’s prefix to determine what the values applies to.
🔸 PEA: Max Opportunity Available (RISK): It’s the most profitable close reached post-trade, measured from the trade’s Exit Fill, expressed in the X value of the trade the PEA follows.
🔸 PEA: Drawdown to Max Opportunity (RISK): This is the maximum drawdown from the trade’s Exit Fill that needs to be sustained in order to reach the maximum opportunity point, also expressed in X. Note that PEA numbers do not include slippage and fees.
Export to Microsoft Excel
All those data can be exported to Excel and analyzed with pivot tables.
Definition
A pivot table is a table of statistics that summarizes the data of a more extensive table. This summary might include sums, averages, or other statistics, which the pivot table groups together in a meaningful way. Pivot tables are a technique in data processing.
I even made a video on TradingView showing how to do it